
World Insurance in 2015

No 3 /2016 World insurance in 2015: 01 Executive summary 03 The global economy and steady growth amid inancial marets in 201 regional disparities 0 nsurance premium growth steady 16 lobal trade and insurance maret growth 22 dvanced maret premiums grow aster than € 2 Emerging marets continue to gain global share 3 ‚ethodology and data 3ƒ „tatistical appendix
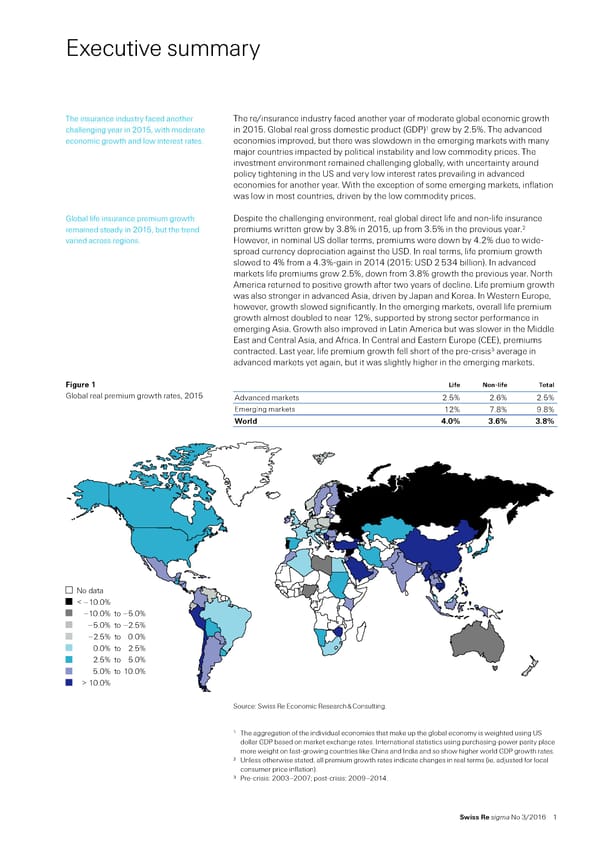
Executive summary The insurance industry aced another The re/insurance industry aced another year o moderate global economic growth 1 challenging year in 201‰ with moderate in 201… lobal real gross domestic product †€‡ grew by 2…ˆ… The advanced economic growth and low interest rates… economies improved‰ but there was slowdown in the emerging marets with many maŠor countries impacted by political instability and low commodity prices… The investment environment remained challenging globally‰ with uncertainty around policy tightening in the ‹„ and very low interest rates prevailing in advanced economies or another year… Œith the exception o some emerging marets‰ inlation was low in most countries‰ driven by the low commodity prices… lobal lie insurance premium growth espite the challenging environment‰ real global direct lie and nonŽlie insurance premiums written grew by 3…ˆ in 201‰ up rom 3…ˆ in the previous year…2 remained steady in 201‰ but the trend varied across regions… ‘owever‰ in nominal ‹„ dollar terms‰ premiums were down by ’…2ˆ due to wideŽ spread currency depreciation against the ‹„… n real terms‰ lie premium growth slowed to ’ˆ rom a ’…3ˆŽgain in 201’ †201“ ‹„ 2 3’ billion‡… n advanced marets lie premiums grew 2…ˆ‰ down rom 3…ˆ growth the previous year… North merica returned to positive growth ater two years o decline… ”ie premium growth was also stronger in advanced sia‰ driven by •apan and –orea… n Œestern Europe‰ however‰ growth slowed signiicantly… n the emerging marets‰ overall lie premium growth almost doubled to near 12ˆ‰ supported by strong sector perormance in emerging sia… rowth also improved in ”atin merica but was slower in the ‚iddle East and —entral sia‰ and rica… n —entral and Eastern Europe †—EE‡‰ premiums contracted… ”ast year‰ lie premium growth ell short o the preŽcrisis3 average in advanced marets yet again‰ but it was slightly higher in the emerging marets… Figure 1 Life Non-life Total lobal real premium growth rates‰ 201 dvanced marets 2…ˆ 2…6ˆ 2…ˆ Emerging marets 12ˆ ƒ…ˆ ¡…ˆ World 4.0 . . No data < –10.0% –10.0% to –5.0% –5.0% to –2.5% –2.5% to 0.0% 0.0% to 2.5% 2.5% to 5.0% 5.0% to 10.0% > 10.0% „ource“ „wiss ˜e Economic ˜esearch ™ —onsulting… 1 The aggregation o the individual economies that mae up the global economy is weighted using ‹„ dollar € based on maret exchange rates… nternational statistics using purchasingŽpower parity place more weight on astŽgrowing countries lie —hina and ndia and so show higher world € growth rates… 2 ‹nless otherwise stated‰ all premium growth rates indicate changes in real terms †ie‰ adŠusted or local consumer price inlation‡… 3 €reŽcrisis“ 2003–200ƒŸ postŽcrisis“ 200¡–201’… Swiss Re sigma No 3/2016 1
Executive summary Non-life premium growth improved in Global non-life premium growth improved to 3.6% in 2015 from 2.% the previou 2015… mainl driven b the advanƒed ear 2015 2 020 billion €. ‚he advanƒed mar„et were the main driver… with mar„et. all region other than †ƒeania e‡perienƒing higher growth rate. ˆdvanƒed ˆia ‰.1%€ regitered the highet growth among the advanƒed region… and there wa a ƒoniderable gain in North ˆmeriƒa ‰3.2%€ alo. Growth wa moderate in Šetern ‹urope ‰1.5%€… but that wa neverthele an improvement on previou ear of tagnation. ‹merging mar„et ƒontinued their robut premium growth trend ‰Œ.Ž%€… primaril driven b ‘hina. †ther mar„et in emerging ˆia were olid alo… a were the ’iddle ‹at and ‘entral ˆia ‰“.0%€. ”n ‘‹‹… non-life premium ƒontraƒted… due to a harp fall in •uia. –rofitabilit wa under preure in both –rofitabilit in life and non-life remained under preure in 2015. ”n life… moderate life and non-life… but both eƒtor are well premium growth in man mar„et and the prolonged low interet rate dragged on ƒapitalied. profit. ”n non-life… both the underwriting and invetment reult wa wea„er than in 201. ‚he underwriting reult wa impaƒted b lower reerve releae and invetment reult were hit b low interet rate. —owever… the inuranƒe indutr overall remain well ƒapitalied. ˜ife premium growth in the advanƒed ˜ife premium growth i e‡peƒted to aƒƒelerate lightl in the advanƒed eƒonomie mar„et will improve lightl… but non-life in 2016… mainl driven b a modet improvement in Šetern ‹urope and a reƒover premium growth will moderate. in †ƒeania. ”n the emerging mar„et… the life eƒtor i foreƒat to deƒelerate inƒe premium growth in ‘hina i e‡peƒted to low from the high level of 2015. ‚he out- loo„ for the non-life indutr in advanƒed mar„et i more muted than for life… given e‡peƒtation of a moderate eƒonomiƒ reƒover and priƒing wea„ne. ‚he outloo„ for non-life in the emerging mar„et i mi‡ed. –remium growth will li„el be trong in emerging ˆia… mainl upported b ‘hina. ”n other emerging region… however… premium growth i e‡peƒted to wea„en or even ƒontraƒt. ‚he peƒial ƒhapter of thi sigma foƒue ‚rade flow have lowed in reƒent ear. Global trade grew about twiƒe a fat a on lower trade growth and it world G– between the earl 1““0 and mid-2000… but ha grown at the ame impliƒation for related line of inuranƒe. paƒe a G– in more reƒent ear. ‚he lowdown ha in part been ƒƒliƒal due to luggih eƒonomiƒ growth… and trade hould piƒ„ up again onƒe eƒonomiƒ aƒtivit aƒƒelerate. —owever… the lowdown alo refleƒt deeper… truƒtural faƒtor… uƒh a a limit in the further diperion of global uppl ƒhain… proteƒtionim and the tranitioning of the ‘hinee eƒonom from e‡port- and invetment-led growth to dometiƒ erviƒe and ƒonumption. ‚he negative impaƒt of the trade lowdown on global growth reduƒe eƒtor-wide premium growth generall. ˆ peritent lowdown in global trade will affeƒt marine and ƒredit inuranƒe growth in partiƒular. ‚he data in thi tud are the latet ‚hi sigma tud ƒontain the latet mar„et data available at the time of going to available at the time of going to pre. pre. ‚he final figure for 2015 are not available for mot inuranƒe mar„et. ˆ uƒh… the sigma alo ƒontain wi •e ‹ƒonomiƒ •eearƒh ™ ‘onulting etimate and proviional data releaed b upervior authoritie and inuranƒe aoƒiation. 2 Swiss Re sigma No 3/2016
The global economy and inancial marets in 201 lobal economic growth uneven across regions The global economy grew moderately in The global re/insurance industry aced another year o moderate economic growth 201… in 201… lobal real gross domestic product †€‡ was up 2…ˆ‰ above the postŽ crisis annual average o 2…2ˆ… rowth in advanced marets continued to improve‰ to 1…¡ˆ rom 1…ˆ in 201’… This was still below the preŽcrisis but exceeded the postŽ crisis average by 1 percentage point †ppt‡… Emerging marets’ aggregate growth was disappointing at 3…ˆ‰ less than hal the preŽinancial crisis average growth levels o ƒ…’ˆ‰ and below the postŽcrisis average o ’…ƒˆ… rowth in the advanced marets mong the advanced marets‰ the ‹„ economy expanded by 2…’ˆ‰ while growth continued to improve slightly … in —anada ell to 1…2ˆ rom 2…ˆ in 201’… Total € growth in North merica ell to 2…3ˆ‰ slightly short o the preŽcrisis but 1 ppt more than the postŽcrisis annual average growth rate… •apan’s economy grew slightly ater a shallow recession in 201’… n Œestern Europe‰ growth improved to 1…ˆ in 201 †201’“ 1…’ˆ‡‰ supported by low interest rates‰ low oil prices and a relatively wea euro… The ‹– outperormed its continental peers again while within the Euro area‰ ermany and „pain grew aster than ¥rance and taly‰ where structural reorms are still much needed… … but emerging maret growth was ggregate emerging maret growth was wea at 3…ˆ‰ with some countries wea‰ with some countries impacted by struggling with low commodity prices and political instability… rowth in other low commodity prices and political marets‰ however‰ most notably —hina‰ —EE E‹ member countries and rican instability… nonŽcommodity exporters‰ remained solid… eep recessions in ¦ra§il and ¨ene§uela dragged on overall perormance in ”atin merica… ¦ra§il’s economy contracted by 3…ˆ‰ suering rom low commodity prices‰ high inlation and political uncertainty… n ‚exico‰ industrial activity was low while private consumption remained healthy… Economic growth in most —EE countries was solid but recession in ˜ussia †€ ell 3…ƒˆ‡‰ due to low oil prices and sanctions because o the ‹raine conlict‰ weighed on the region’s aggregate growth †–1…2ˆ‡… ndia overtoo —hina as the world’s The emerging sian economies expanded unevenly last year… —hina’s economy astest growing large economy… continued its transition rom manuacturing to services‰ and growth slowed to 6…¡ˆ‰ Šust below the government’s target o ƒˆ… ndia was the world’s astestŽexpanding large economy †£ƒ…3ˆ‡ in 201‰ with business and consumer sentiment improving signiicantly on expectations o a strong push towards economic reorm and liberali§ation by the Narendra ‚odi government… ‚aŠor economies in rica developed ‚aŠor economies in rica developed unevenly‰ driven largely by political unevenly due to political uncertainties developments and lower oil and commodity prices… rowth in „outh rica was and dependency on commodities… sluggish with companies there having to contend with lower commodity prices‰ wea domestic demand‰ electrical outages‰ worer stries and rising input costs… Nigeria and ngola suered rom low oil prices and inrastructure bottlenecs‰ while many oilŽimporting countries grew solidly †eg‰ ‚orocco‰ –enya and —ôte d’voire‡… n the ‚iddle East and —entral sia‰ „audi rabia experienced solid growth‰ supported by greater public spending‰ despite collapsing government revenues rom oil… rowth in Turey was robust‰ despite civil disturbance and political turmoil… Swiss Re sigma No 3/2016 3
T‚e gloƒal econo€ and financial ar„ets in 2015 Figure 2 rld ˜eal € growth by region in 201‰ and preŽ and postŽinancial crisis average Adanced markets rth America estern Ere Adanced Asia ceania Emerging markets Emerging markets excl. China Emerging Asia Emerging Asia excl. China Latin America and the Caribbean Central and Eastern Ere Middle East and Central Asia Aˆrica –2% 0% 2% 4% 6% 8% 10% †r‚th rate 201‡ re€crisis aerage gr‚th 200„–200… st€crisis aerage gr‚th 200ƒ–2014 ˜emars“ —ountries’ € weighted with maret exchange rates… „ource“ ¢xord Economics‰ ŒŒ‰ „wiss ˜e Economic ˜esearch ™ —onsulting… nterest rates and headline inlation approach §ero The E—¦ continued «uantitative easing‰ —entral ban intervention‰ policy divergence and uncertainty drove the inancial but the ‹„ ¥ed raised rates once… marets in 201‰ and interest rates were at record lows… The European —entral ¦an †E—¦‡ and the ¦an o •apan †¦o•‡ continued their expansionary and unconventional monetary policies as the Euro area and •apanese economies remained ragile with delation an ongoing ris… n contrast‰ the ‹„ ¥ederal ˜eserve ¦oard made a small move towards monetary policy normalisation with an interest rate hie in ecember… Figure 6.0% ”ongŽterm interest rates‰ ecember 200 to pril 2016 5.0% 4.0% 3.0% 2.0% 1.0% 0.0% –1.0% Dec 2005Apr 2006Aug 2006Dec 2006Apr 2007Aug 2007Dec 2007Apr 2008Aug 2008Dec 2008Apr 2009Aug 2009Dec 2009Apr 2010Aug 2010Dec 2010Apr 2011Aug 2011Dec 2011Apr 2012Aug 2012Dec 2012Apr 2013Aug 2013Dec 2013Apr 2014Aug 2014Dec 2014Apr 2015Aug 2015Dec 2015Apr 2016 US Japan Germany U France „ource“ atastream… ’ Swiss Re sigma No 3/2016
n the emerging marets‰ policy rates nticipation o a ‹„ interest rate hie ept yields on ‹„ and ‹– 10Žyear government diverged… bonds about 1… ppt above the erman and •apanese e«uivalents †¥igure 3‡… The ‹„ too a irst step to monetary policy normalisation in 201‰ but interest rates in the advanced economies remain historically low †see ¦ox“ ”ow interest rates orever¬‡… Even so‰ inlation in the ‹„‰ the Euro area and the ‹– dropped close to §ero last year‰ based largely on low commodity prices… n the ‹„‰ core inlation‰ which excludes ood and energy‰ was essentially unchanged at 1…ˆ… nlation in •apan ell below 1ˆ ater rising to 2…¡ˆ in 201’ due to the sales tax increase in pril 201’… —risisŽhit ¦ra§il and ˜ussia increased policy rates in an attempt to counter capital outlows and inlation… n contrast‰ —hina and ndia both reduced their policy rates… t was a mixed year or stocs in the „toc maret perormance in advanced marets was mixed… The „™€ 00 in the ‹„ advanced marets… was down 0…ƒˆ‰ and the ‚„— ‹– index was down …¡ˆ… ¦y contrast‰ the •apanese Niei 22 was up ¡…1ˆ and the erman ® 30 by ¡…6ˆ †¥igure ’‡… The mixed perormance relects the diverging paths o monetary policy… ter three consecutive years o ending in positive territory‰ the world’s maŠor e«uity marets slowed due to increased uncertainty‰ wea proit growth and investor caution… Figure 4 10 „toc maret perormance‰ 201’–2016 †ecember 201’ ¯ 100‡ 1ƒ0 110 100 90 Ž0 70 an ƒ01‡„e… ƒ01‡Mar ƒ01‡€r ƒ01‡Ma ƒ01‡‹n ƒ01‡‹Œ ƒ01‡‹g ƒ01‡Se€ ƒ01‡Š†t ƒ01‡‚ˆ‰ ƒ01‡e† ƒ01‡an ƒ015„e… ƒ015Mar ƒ015€r ƒ015Ma ƒ015‹n ƒ015‹Œ ƒ015‹g ƒ015Se€ ƒ015Š†t ƒ015‚ˆ‰ ƒ015e† ƒ015an ƒ01 „e… ƒ01 Mar ƒ01 €r ƒ01 Ma ƒ01 US (S&P 500): –0.7% a€an (‚ikkei ƒƒ5): 9.1% MSCI UK: –5.9% erman ( 0): 9. % MSCI Emerging Markets: –17% Note“ percent values indicate yearŽonŽyear change o respective indices in 201… „ource“ atastream… Emerging maret stoc indices ell „toc marets in the emerging marets suered substantial losses driven by alling substantially… commodity prices‰ heightened political instability in many regions and uncertainty around ‹„ monetary policy… The ‚„— Emerging ‚arets index ell by 1ƒˆ in 201‰ but recovered partially in the irst «uarter o 2016… Swiss Re sigma No 3/2016
T‚e gloƒal econo€ and financial ar„ets in 2015 ¢utloo“ improving‰ but interest rates to rise only moderately There will liely be heightened maret The global economy aces our maŠor headwinds that will produce periods o maret volatility alongside moderate global volatility alongside moderate growth in 2016 and 201ƒ“ the ‹„ ¥ederal ˜eserve growth in the next two years… will continue to raise interest ratesŸ —hina continues to open its capital accountŸ commodity prices have stabili§ed at low levels and are unliely to increase substantiallyŸ and global political developments continue to create uncertainty… Nevertheless‰ in advanced marets economic undamentals remain strong… n the ‹„‰ real € is expected to continue to grow steadily this year and next‰ and employment and income growth are expected to remain strong… The Euro area is beneiting rom a wea euro and low oil prices‰ and growth is orecast to improve in each o the next two years… „table growth is liely in the ‹–‰ where consumer spending and housing construction have sustained momentum in the irst hal o 2016‰ in spite o the uncertainty created by the ¦rexit reerendum which has ’ dampened business investment and hiring… Economic growth in the emerging Economic growth in emerging marets is orecast to improve in 2016‰ relecting marets is orecast to pic up‰ but reduced recessionary pressures in ey marets in ”atin merica and —EE… ‘owever‰ challenges remain… wea growth in trade is liely to continue and inancial volatility‰ currency depreciation and capital outlows will remain ey challenges or many emerging economies… rowth in —hina is expected to slow in 2016‰ while ¦ra§il and ˜ussia will liely remain stuc in recession… n ¦ra§il challenges to governability will remain ollowing the recent impeachment o €resident ˜ousse‰ given the heavily charged and polari§ed political atmosphere… n ˜ussia low oil prices and the continuation o sanctions are holding bac growth… ˜is o an emerging maret inancial crisis continues‰ as indicated by wide emerging maret bond spreads… ‘owever‰ the threat o contagion is limited due to stronger inancial buers in individual marets and also enorcement o precautionary macroŽprudential measures… ‚onetary policy divergence will lobal monetary policy divergence will continue in 2016 ater the ¦o• surprised continue‰ and inlation is expected to marets with negative interest rates in •anuary and the E—¦‰ in ‚arch‰ announced accelerate‰ particularly in the ‹„… urther extension o its unconventional policy measures… nlation in the ‹„ is orecast to rise‰ and the ¥ed is expected to raise its policy rate two times in 2016… The slow pace o monetary tightening has increased the ris o inlation… The ¦an o England †¦oE‡ will liely ollow suit‰ with two rate hies starting in ugust ater the ¦rexit reerendum… n contrast‰ the E—¦ and ¦o• are more liely to ease monetary policy urther… n such an environment‰ yields on the ‹„ and ‹– 10Žyear government bonds are liely to rise modestly‰ to 2…2ˆ and 2…0ˆ‰ respectively‰ by endŽ2016… erman and •apanese 10Žyear yields will also rise‰ but by less †to 0…ˆ and 0ˆ‡… Their low value is essentially pulling down ‹„ and ‹– yields… volatility subsides‰ e«uity marets could improve and credit spreads could narrow urther this year… The global economy will liely muddle ‚any downside riss to the global economy remain… n the ‹„‰ the ris is inlation through in 2016‰ but downside riss ollowed by moreŽrapidŽthanŽexpected monetary tightening… n the Euro area‰ a remain… “rexit” could become a problem again as implementation o reorms is lagging… ‘owever‰ contagion ris has declined over the last ew years and the E—¦ has become a credible lender o last resort… mmigration will remain an issue in Europe and could compromise proŽreorm governments and/or delay implementation o structural reorms… n —hina economic and inancial riss remain high… The country is pursuing contradictory policies as it attempts to simultaneously liberalise its capital account‰ lower interest rates to support growth and maintain a stable exchange rate… string o unavourable events‰ such as deaults by property developers or local governments‰ or a sharp renminbi depreciation and capital outlows‰ would increase the lielihood o a hardŽlanding… 4 The result o the 23 •une 2016 vote in the ‹– on whether to stay in the E‹ was not nown at the time o going to print… 6 Swiss Re sigma No 3/2016
Low interest rates fore er… nterest rates remain very low ater the ter the inancial crisis‰ maŠor central bans ept policy rates at close to §ero or inancial crisis… about seven years to support economic recovery and put upward pressure on prices… n this context‰ the conse«uences o the interest rate hie by the ‹„ ¥ed in ecember 201 and the direction o longŽterm interest rates raise ey «uestions or insurers… This is because income rom inancial assets is an important part o earnings‰ although not all lines o business are aected to the same degree… Œill interest rates inally rise and go bac to preŽcrisis levels¬ eneva ˜eport inds that longŽterm uring the last three decades‰ yields or 10Žyear government bonds have decreased government bond yields have allen or steadily… ‘owever‰ inlation expectations‰ calculated by the dierence in yields rom three decades‰ but inlation expectations inlationŽprotected and unprotected bonds‰ remained relatively stable‰ relecting the have remained stable… credibility o central bans’ inlation targets… recently published eneva ˜eport on the world economy thereore associates the all in yields during the last two decades with lower real interest rates‰ rather than with a decline in inlation expectations… ¢ther actors could be at play in the The inancial crisis and the subse«uent reaction o central bans caused Šust a small longŽterm downtrend in interest rates… dip in the longŽterm down trend o real interest rates… ‘ence‰ other drivers need to be at wor… The eneva report ocuses on dierent explanations“ ̤ n ageing population in most parts o the world led to an increase in the aggregate propensity to save‰ some o which went into ixed income assets‰ lowering real interest rates… ̤ nother contributing actor has been the increase in savings in —hina… The higher savings coupled with —hina’s increased inancial integration‰ led to large capital outlows into global inancial marets… ̤ shit in investor preerences away rom risy assets towards sae bonds is another liely driver or lowering real interest rates… ccording to the report‰ interest rates These actors may persist or some time‰ and re/insurers need to be prepared to could eventually rise again… cope with low interest rates or a while yet… ‘owever‰ the report also mentions that with time‰ interest rates could increase as the causes o the downward trend reverse“ ̤ ¥irst‰ aggregate savings levels could decrease as the cohort o current savers continues to move towards retirementŸ ̤ „econd‰ with the shit in —hina rom investment and exportled growth to a more consumptionŽdriven economy‰ the —hinese outlow o capital into global inancial marets may also stabiliseŸ and ̤ ¥inally‰ a gradual return o investors into more risy assets could alleviate pressure on interest rates… 5 Low for Long? Causes and Consequences of Persistently Low Interest Rates, ¢ctober 201‰ nternational —enter or ‚onetary and ¦aning „tudies †—‚¦‡ and —entre or Economic €olicy ˜esearch †—E€˜‡… Swiss Re sigma No 3/2016 ƒ
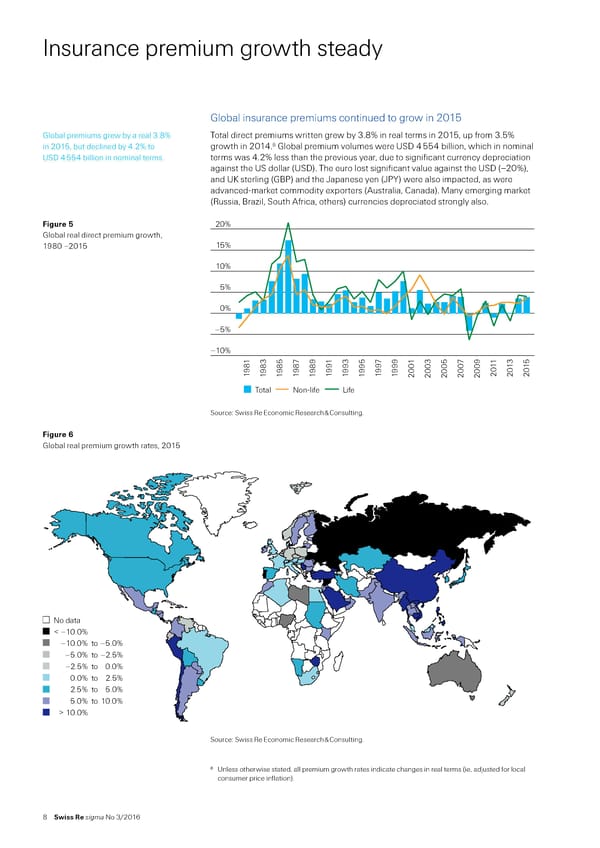
nsurance premium growth steady lobal insurance premiums continued to grow in 201 lobal premiums grew by a real 3…ˆ Total direct premiums written grew by 3…ˆ in real terms in 201‰ up rom 3…ˆ 6 in 201‰ but declined by ’…2ˆ to growth in 201’… lobal premium volumes were ‹„ ’ ’ billion‰ which in nominal ‹„ ’ ’ billion in nominal terms… terms was ’…2ˆ less than the previous year‰ due to signiicant currency depreciation against the ‹„ dollar †‹„‡… The euro lost signiicant value against the ‹„ †–20ˆ‡‰ and ‹– sterling †¦€‡ and the •apanese yen †•€µ‡ were also impacted‰ as were advancedŽmaret commodity exporters † ustralia‰ —anada‡… ‚any emerging maret †˜ussia‰ ¦ra§il‰ „outh rica‰ others‡ currencies depreciated strongly also… Figure 5 20% lobal real direct premium growth‰ 1¡0 –201 15% 10% 5% 0% –5% –10% 1 3 5 7 9 1 3 5 7 3 5 9 11 13 15 8 8 8 8 8 9 9 9 9 999 01 0 0 07 0 0 0 0 19 19 19 19 19 19 19 19 19 1 0 0 2 2 2 2 20 20 2 20 Total Non-life Life „ource“ „wiss ˜e Economic ˜esearch ™ —onsulting… Figure lobal real premium growth rates‰ 201 No data < –10.0% –10.0% to –5.0% –5.0% to –2.5% –2.5% to 0.0% 0.0% to 2.5% 2.5% to 5.0% 5.0% to 10.0% > 10.0% „ource“ „wiss ˜e Economic ˜esearch ™ —onsulting… 6 ‹nless otherwise stated‰ all premium growth rates indicate changes in real terms †ie‰ adŠusted or local consumer price inlation‡… Swiss Re sigma No 3/2016
”ie insurance“ positive overall growth mass regional disparities †reiu de elo‡ent lobal lie insurance premiums rose by lobal direct lie premiums written totalled ‹„ 2 3’ billion in 201‰ down ’…6ˆ ’…0ˆ in 201‰ slightly slower than in the in nominal terms but up ’…0ˆ in real terms ater a ’…3ˆŽreal gain in 201’… n the last previous year… two years‰ global lie premium growth has exceeded both the preŽ and postŽcrisis averages †see ¥igure ƒ‡… ‘owever‰ the overall growth mass considerable variation across regions and countries… ”ast year premium growth in the advanced marets slowed‰ but accelerated in the emerging marets… Figure ˆ World ”ie premium growth in the advanced and emerging marets in 201‰ and Advanced markets preŽ and postŽinancial crisis averages North America Western Europe Advanced Asia Oceania Emerging markets Emerging markets excl. China Emerging Asia Emerging Asia excl. China Latin America and the Caribbean Central and Eastern Europe Middle East and Central Asia A…rica † „† † „† † „† † ƒroth rate „ Precrisis average groth €‚ Postcrisis average groth „ource“ „wiss ˜e Economic ˜esearch ™ —onsulting… €remium growth in the advanced n the advanced marets‰ premiums recovered in North merica ollowing two years marets slowedŸ it accelerated in o contraction… There was also renewed momentum in •apan… n ¢ceania‰ however‰ the emerging marets… marets declined sharply‰ mainly due to base eects ater very solid growth in ustralia in 201’… There was minimal growth in Œestern Europe‰ mainly due to a contraction in ermany… mong the emerging marets‰ growth was particularly strong in emerging sia‰ supported by solid gains in a number o countries including —hina‰ ndia‰ ndonesia and the €hilippines… ”ie premium growth also strengthened in ”atin merica and remained on a positive trac in rica‰ the ‚iddle East and —entral sia… The improvement in ”atin merica relects robust growth in ¦ra§il and a strong rebound in —hile… ¦y contrast‰ premiums in —EE were down or a third year running‰ mainly because o the two largest marets‰ €oland and the —§ech ˜epublic †see page 32‡… espite signs o recovery o late‰ overall espite the aboveŽaverage growth rates in 201’ and 201‰ lie insurance premiums lie premium growth has been sluggish have been sluggish since the inancial crisis in 200… ¢n average‰ advancedŽmaret since the inancial crisis… premiums have stagnated since then‰ with very little and even negative lie premium growth in Œestern Europe and North merica… The emerging marets have also slowed maredly‰ with premium growth less than hal preŽcrisis levels… Swiss Re sigma No 3/2016 ¡
Insurance premium growth steady Figure 8 •ie real remium growth 201 No data < –10.0% –10.0% to –5.0% –5.0% to –2.5% –2.5% to 0.0% 0.0% to 2.5% 2.5% to 5.0% 5.0% to 10.0% > 10.0% Source: Swiss Re Economic Research & Consulting. Life insurers’ profitability and capital position –roitailit in the lie sector remains Gloal lie inustr roitailit remaine uner ressure in 201 with return on uner ressure. ”owe‰er the inustr euit €R‚Eƒ at aout 12„ €see …igure †ƒ. R‚E is e‡ecte to remain elow reˆ is well caitalise. crisis le‰els in the nearˆ an meium term. ‚ngoing heawins are the moerate remium growth in man marŠets an rolonge low interest rates. ‹n some countries on iels are e‰en negati‰e. ‹nsurers rom Canaa an Œestern Euroe in articular contriute to the weaŠ earˆonˆear €oƒ R‚E outcome in the ourth uarter o 201. Žmong ‘S insurers most o the imro‰ement in a‰erage R‚E was ecause o an increase in the net income o one coman ue to ositi‰e ore‡ e‰eloments. …rom an accounting ersecti‰e the lie sector reorte stronger caitali’ation at the en o 201 than in 201“ relecting soli results in China. ”owe‰er the imro‰ement was also artl ri‰en ecreasing interest rates leaing to a higher marŠˆtoˆmarŠet ‰alue o i‡eˆincome an eri‰ati‰e in‰estments. 10 Swiss Re sigma No 3/2016
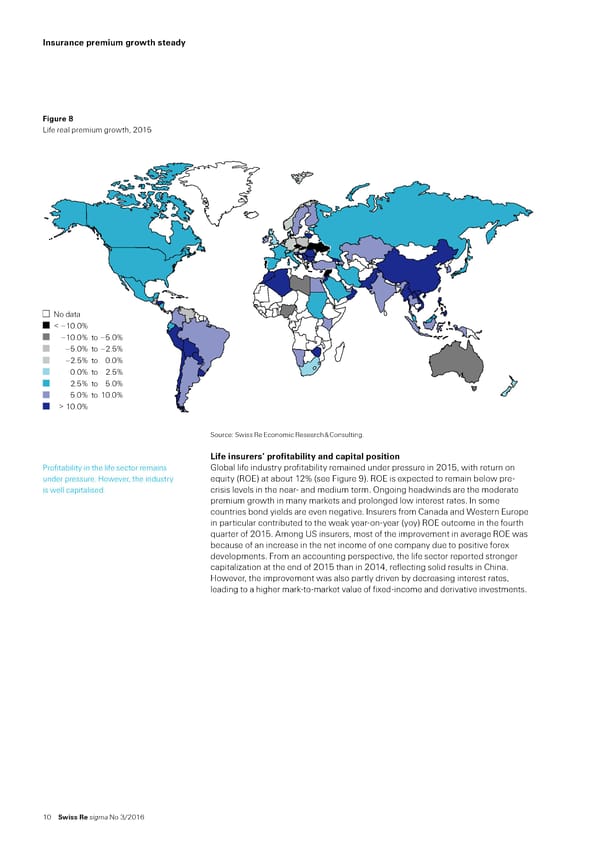
Figure ‹ ˜eturn on e«uity †let panel‡ and shareholder e«uity †right‡ o large lie insurers and globals with lie business 25… 325 (4Q07 = 100) 20… 300 275 15… 250 225 10… 200 5… 175 150 0… 125 –5… 100 75 –10… 50 7 ƒ ƒ ‚ ‚ 0 0 1 1 2 2 3 3 4 4 5 5 7 ƒ ƒ ‚ ‚ 0 0 1 1 2 2 3 3 4 4 5 5 4Q0 2Q0 4Q0 2Q0 4Q0 2Q1 4Q1 2Q1 4Q1 2Q1 4Q1 2Q1 4Q1 2Q1 4Q1 2Q1 4Q1 4Q0 2Q0 4Q0 2Q0 4Q0 2Q14Q1 2Q1 4Q1 2Q1 4Q1 2Q1 4Q1 2Q1 4Q1 2Q14Q1 3 Canadian companies 10 companies 7 ropean o€as 2 Chinese companies companies Market cap weighted average ƒ Note“ ¦ased on a sample o companies ‰ missing 1·/3· values are interpolated… „ources“ —ompany reports‰ ¦loomberg‰ „wiss ˜e Economic ˜esearch ™ —onsulting… Life insurance industr€ outloo„ ”ie premiums will liely grow in the ”ie premiums are expected to grow in both the advanced and emerging marets in advanced and emerging marets in 2016 … 2016… rowth is orecast to accelerate slightly in the advanced but decelerate in the emerging countries… The small improvement in the advanced marets will come rom an expected recovery in ¢ceania and modest acceleration in Œestern Europe… n North merica‰ growth will remain roughly stable… n the emerging marets‰ the pace o growth relects sustained strong perormance in emerging sia… €remium growth in —hina‰ though slowing‰ is expected to remain strong in 2016… The astŽgrowing sharia compliant/taaul business in ndonesia and ‚alaysia is expected to urther beneit the lie sector… n contrast‰ growth in ”atin merica will remain below recent trend levels due to price competition‰ demand weaness and heightened inancial and economic volatility… ”ie premiums will also remain under pressure in most —EE E‹ countries‰ and are expected to decline in ˜ussia due to the ongoing economic diiculties there… n rica‰ lie insurance penetration is still very low‰ so there is ample potential or growth… … although the overall environment will nterest rates and the macroeconomic and inancial maret environment will continue remain challenging… to shape the outloo or the primary lie insurance industry… ownside riss rom Šust modest global economic growth‰ persistently low interest rates‰ volatility in the inancial marets and regulatory changes remain signiicant in the shortŽ and mediumŽterm… Œith proitability under pressure‰ lie insurers will continue to ocus on improving capital management‰ lowering expenses and enhancing investment yields… 7 ¥” —Ÿ llian§Ÿ ssurant ncŸ vivaŸ ® Ÿ —hina ”ieŸ —N€Ÿ eneraliŸ enworth ¥inancialŸ reatŽŒest ”iecoŸ ‘artordŸ ”egal ™ eneralŸ ”incoln NationalŸ ‚anulieŸ ‚et”ie roupŸ ¢ld ‚utualŸ €ing nŸ €rudential †‹–‡Ÿ €rudential †‹„‡Ÿ „t… •ames €lace Ÿ „tan—orp ¥inancial roupŸ „tandard ”ieŸ „torebrand „ Ÿ „un ”ieŸ „wiss ”ieŸ TorchmarŸ ‹N‹‚ roupŸ ¹urich… Swiss Re sigma No 3/2016 11
‰nsurance ‡reiu growt‚ stead€ NonŽlie“ higher premium growth‰ driven by advanced marets Non-life insurance ‡reiu de elo‡ent lobal nonŽlie premium growth lobal nonŽlie insurance sector improved urther in 201‰ with premiums up 3…6ˆ in improved urther in 201‰ mainly real terms to ‹„ 2 020 billion‰ higher than the 2…’ˆŽgain registered in 201’ and driven by advanced marets… also better than preŽcrisis average growth †see ¥igure 10‡… ‘owever‰ in nominal ‹„ terms‰ premiums ell 3…ˆ due to currency depreciations against the dollar… The advanced marets were the main drivers‰ with higher growth registered in all regions except ¢ceania †lat at £0…1ˆ‡… dvanced sia †£’…1ˆ‡ registered the highest growth among the advanced regions and premiums in North merica were also solid †£3…2ˆ‡… Œestern Europe premiums showed moderate growth †£1…ˆ‡ ater several years o stagnation… Figure 10 World NonŽlie premiums growth in the advanced and emerging marets in Advanced markets 201‰ preŽ and postŽinancial crisis North America averages Western Europe Advanced Asia Oceania Emerging markets Emerging markets excl. China Emerging Asia Emerging Asia excl. China Latin America and the Caribbean Central and Eastern Europe Middle East and Central Asia Africa †‡ ‚‡ ‡ ‚‡ †‡ ‡ ‡ …‡ „roth rate … recrisis average groth ‚ ƒ ostcrisis average groth € „ource“ „wiss ˜e Economic ˜esearch ™ —onsulting… Emerging maret premiums growth n the emerging marets‰ premium growth slowed to a stillŽrobust ƒ…ˆ in 201 rom slowed but remained solid… …6ˆ in 201’‰ but was below the preŽcrisis average o 10ˆ… rowth trends among regions were mixed… —hina was the main driver‰ with premiums there increasing by 1ƒˆ… n the ‚iddle East and —entral sia‰ growth remained solid at ¡ˆ‰ and liewise in emerging sia excluding —hina at …¡ˆ… ‘owever‰ in most regions the level o premium growth was lower than in 201’… rowth was slow in rica †£1…3ˆ‡ and ”atin merica †£2…3ˆ‡… This was still higher than in —EE where premiums were down ’…¡ˆ‰ with sharp contractions in ˜ussia and the ‹raine osetting more positive results in other countries… 12 Swiss Re sigma No 3/2016
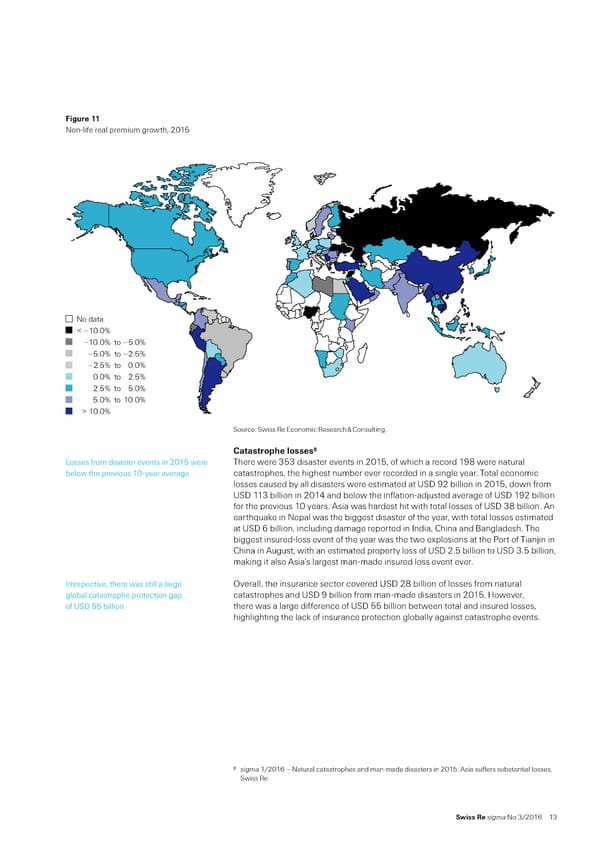
Figure 11 NonŽlie real premium growth‰ 201 No data < –10.0% –10.0% to –5.0% –5.0% to –2.5% –2.5% to 0.0% 0.0% to 2.5% 2.5% to 5.0% 5.0% to 10.0% > 10.0% „ource“ „wiss ˜e Economic ˜esearch ™ —onsulting… Œatastro‡‚e losses ”osses rom disaster events in 201 were There were 33 disaster events in 201‰ o which a record 1¡ were natural below the previous 10Žyear average… catastrophes‰ the highest number ever recorded in a single year… Total economic losses caused by all disasters were estimated at ‹„ ¡2 billion in 201‰ down rom ‹„ 113 billion in 201’ and below the inlationŽadŠusted average o ‹„ 1¡2 billion or the previous 10 years… sia was hardest hit with total losses o ‹„ 3 billion… n earth«uae in Nepal was the biggest disaster o the year‰ with total losses estimated at ‹„ 6 billion‰ including damage reported in ndia‰ —hina and ¦angladesh… The biggest insuredŽloss event o the year was the two explosions at the €ort o TianŠin in —hina in ugust‰ with an estimated property loss o ‹„ 2… billion to ‹„ 3… billion‰ maing it also sia’s largest manŽmade insured loss event ever… rrespective‰ there was still a large ¢verall‰ the insurance sector covered ‹„ 2 billion o losses rom natural global catastrophe protection gap catastrophes and ‹„ ¡ billion rom manŽmade disasters in 201… ‘owever‰ o ‹„ billion… there was a large dierence o ‹„ billion between total and insured losses‰ highlighting the lac o insurance protection globally against catastrophe events… 8 sigma 1/2016 – Natural catastrophes and manŽmade disasters in 201“ sia suers substantial losses‰ „wiss ˜e… Swiss Re sigma No 3/2016 13
‰nsurance ‡reiu growt‚ stead€ Non-life insurers’ ‡rofitaƒilit€ and ca‡ital ‡osition NonŽlie proitability weaened in 201 The overall proitability o nonŽlie insurance‰ measured by ˜¢E‰ declined rom ¡…0ˆ due to low investment returns and weaer in 201’ to ƒ…2ˆ in 201… ‹nderwriting and investment results both declined… underwriting results… nvestment income as a percentage o net premiums earned in eight maŠor marets ell by 0…ƒ ppt to ¡…2ˆ in 201 †see ¥igure 12‡ due to the low interest rate environment… ‹nderwriting results were also down as the pace o reserve releases slowed… ¢verall‰ underwriting proitability in the eight marets deteriorated with the combined ratio moving up to ¡…¡ˆ in 201 rom ¡ƒ…6ˆ in 201’… n the ‹„‰ the industry combined ratio worsened due to rising claims in motor and general liability insurance… n the ‹– and continental Europe‰ motor underwriting results started to deteriorate again ater some improvements previously… n •apan‰ overall underwriting results improved across all lines‰ but the combined ratio in the compulsory motor line remained high… ‹nderwriting perormance in ustralia‰ however‰ deteriorated due largely to poor results in property osetting improvements in compulsory motor… The overall negative trend in proitability is expected to continue in 2016… Figure 12 0% Aggregate of the US, Canada, the UK, Germany, France, Italy, Japan and Atrala —omposition o proits as a ˆ o net 15% premiums earned and ˜¢E‰ aggregate o eight maŠor marets‰ 1¡¡¡–2016 10% 5% 0% –5% –10% –15% 1 000 001 0000 00 00500 00€ 00‚ 00010 011 01 0101 015ƒ01F Under‹rtng relt a a % of net premm earned E = estimate Crrent nŠetment ncome a a % of net premm earned F = forecast Captal gan‰loe a a % of net premm earned After„ta… retrn on e†ty ‡%ˆ „ource“ „wiss ˜e Economic ˜esearch ™ —onsulting… The nonŽlie industry is well capitali§ed… The nonŽlie sector remains well capitalised with solvency at a record high o 130ˆ in 201‰ up rom 12’ˆ in 201’… Nevertheless‰ shareholder e«uity in the eight marets declined marginally in ‹„ terms due to negative currency eects as the ‹„ strengthened… ¢n a local currency basis‰ shareholder e«uity increased… lthough capitalisation is expected to remain strong‰ the support rom higher unrealised gains due to ultraŽlow interest rates will disappear once rates begin to rise †in the ‹„ and ‹– mainly‡… 1’ Swiss Re sigma No 3/2016
Figure 1 USD bn Aggregate of the US, Canada, the UK, Germany, France, Italy, Japan and Australia NonŽlie insurers’ solvency‰ 1¡¡¡–2016 1400 140% 1200 120% 1000 100% 800 80% 600 60% 400 40% 200 20% 0 0% 01 02 03 04 05 06 07 08 09 10 11 12 13 14 E F 999 000 20 20 20 20 20 15 16 1 2 20 20 20 20 20 20 20 20 20 20 20 remiums earned estimate Shareholders euity F forecast Solency euitypremiums – ‚ƒS„ „ource“ „wiss ˜e Economic ˜esearch ™ —onsulting… Non-life insurance industr€ outloo„ ”ower premium rates and wea lobal nonŽlie sector growth is expected to weaen due to moderate economic economic growth will drag on nonŽlie activity and sot pricing‰ mainly in the advanced marets… n North merica‰ premium premium development in advanced growth is expected to slow slightly in 2016 because o price declines in most marets… commercial lines… n Œestern Europe‰ nonŽlie premium growth will remain subdued due to moderate economic recovery… n advanced sia‰ a weaening economic environment will pose challenges to most o the nonŽlie sector‰ but some lines are expected to grow †eg‰ accident ™ health‰ due to increasing awareness and product reŽpricing‡… The nonŽlie sector in ¢ceania will liely be aected by pricing pressures and also regulatory changes †see page 2ƒ‡… rowth in Emerging sia will remain The outloo or emerging marets is mixed… Emerging sia is orecast to grow strong‰ mainly driven by —hina… robustly‰ mainly driven by —hina because o government support or insurance… ¥urther bacing will come rom rate hies in motor thirdŽparty liability †‚T€”‡ insurance in ndia and inrastructure investments in other sian marets… ‘owever‰ detariication o motor in —hina and ‚alaysia could oset some o the positive momentum in the region… NonŽlie premiums in rica and the ‚iddle East and —entral sia will continue to grow but at a lower rate than beore… n ”atin merica‰ growth is expected to be lat due to contraction in ¦ra§il and ¨ene§uela‰ and slower growth in rgentina… n —EE‰ nonŽlie premiums are expected to decline urther due to contraction in ˜ussia‰ where the economy remains stuc in recession… ¢verall nonŽlie sector proitability will NonŽlie insurers’ proitability is expected to continue to be under pressure as remain subdued… investment returns remain depressed and sot maret conditions continue… Swiss Re sigma No 3/2016 1
lobal trade and insurance maret growth ntroduction Trade volumes grew about twice as ast Trade data o the last 10 years tell a straightorward story“ excluding periods o as global output in the two decades prior recession‰ and during and between Œorld Œars and ‰ growth in global trade volumes mostly exceeded growth in global real €…¡ to 200ƒ … The outperormance was most pronounced rom the late 1¡0s to midŽ2000s‰ with trade volumes growing about 10 twice as ast as real €… This was relected by an increase in exports as a share o € rom below 1ˆ to more than 30ˆ during that time †¥igure 1’‡… … driven by maŠor geoŽpolitical and The gains were based on a series o maŠor geoŽpolitical and economic events“ the economic events… end o the —old Œar and reintegration o the —EE countries into the world economyŸ the adoption o an exportŽled growth model in —hina and its integration into global businessŸ the ‹ruguay ˜ound trade negotiations between 1¡6 and 1¡¡’‰ leading to the creation o the Œorld Trade ¢rganisation †ŒT¢‡ and a reduction in average tarisŸ rapid innovation in inormation and communications technologyŸ and ongoing improvements in transport eiciency… ¢ptimisation o production processes with more outsourcing o speciic unctions over time led to a rise in global supply chains… Figure 14 evelopment o global exports relative 0.40 to global € 0.35 Exports to GDP (nominal) 0.30 Exports to GDP (real) 0.25 0.20 0.15 0.10 70 75 80 85 90 95 000 05 10 15 19 19 19 19 19 19 2 20 20 20 Exports to GDP (real)Exports to GDP (nominal) Pre-crisis tren (real) ecessions rey bars indicate global recessions‰ e«uali§ed with global real € growth below 1ˆŸ the dashed line shows the preŽcrisis trends according to the average growth rates between 1¡¡0 and 200ƒ… „ource“ Œorld ¦an‰ „wiss ˜e Economic ˜esearch ™ —onsulting… ‘owever‰ trade has grown in line with There has been a slowdown in global trade in more recent years… This appears more € in more recent years… pronounced in nominal terms than in real terms because“ ̤ ‹„ appreciation“ national values need to be converted to a common currency‰ typically the ‹„… stronger ‹„ reduces the value o exports denominated in other currencies‰ even i prices in local currency terms and volumes increase… The same applies to world €… ‘owever‰ as the ‹„ accounts or a smaller share o world trade than it does or world €‰ converting local currencies to ‹„ to aggregate nominal trade and € causes the ratio between the two variables to decline as the ‹„ appreciates… ̤ ¥alling commodity and manuacturing prices in recent years have led to lower export prices †see ¥igure 1‡… —ommodities and manuactured goods account or a larger share o trade than they do or global output… ecreasing commodity and manuacturing prices thereore have a larger negative eect on nominal exports than on nominal €‰ causing the ratio between the two variables to decline… 9 … rwin‰ “”ongŽrun trends in world trade and income”‰ World Trade Review, 1†1‡ 2002‰ pp… ¡–100… 10 —… —onstantinescu‰ … ‚attoo and ‚… ˜uta‰ “The lobal Trade „lowdownŸ —yclical or „tructural¬”‰ IMF Woring Paers, 1†6‡‰ 201… 16 Swiss Re sigma No 3/2016
Figure 15 140 lobal manuacturing and export price 130 Export price index indices †200¯100‡ 120 Manufacturing price index 110 100 90 80 70 2 4 6 8 2 4 6 8 10 12 14 16 9 9 9 9 000 0 0 0 0 0 0 0 0 19 19 19 19 2 20 20 20 20 2 2 2 2 Manufacturing price index Export price index „ource“ —€¦ Netherlands ¦ureau or Economic €olicy nalysis‰ „wiss ˜e Economic ˜esearch ™ —onsulting… This raises «uestions regarding the outloo ‹„ aggregation eects overstate the magnitude o the recent slowdown in trade‰ o the global tradeŽtoŽ€ ratio… but it is also visible in real terms… This raises the «uestion o whether the trade slowdown is cyclical or relects a structural change in the world economy… nd‰ i the latter‰ how will the decrease in the tradeŽtoŽ€ growth ratio impact global economic growth¬ eterminants o the slowdown Œ€clical factors uring recession‰ the purchase o traded Trade volumes normally respond more than proportionally to movements in real €… 11 goods is oten postponed‰ resulting in rwin explains this by citing that demand or investment and durable consumer high sensitivity o trade volumes to € goods is cyclical‰ growing rapidly in times o strong economic perormance… s these moves… goods represent a large share o global trade volumes‰ recent weaness in global growth is liely having a negative impact on the tradeŽtoŽ€ ratio… ntraŽE‹ trade matters disproportionally The regional composition o world growth is also important… n particular‰ sluggish or global trade‰ and E‹ € growth has growth in the E‹ in recent years has had a disproportionally large impact on global been wea or the last several years… trade volumes“ the E‹ accounts or less than one «uarter o global output‰ but or more than one third o global trade… The substantial trade lows between E‹ member states are included as part o global trade statistics… ‘owever‰ trade within large countries †eg‰ the ‹„ or —hina‡ is not included… —yclical actors explain some o the nother cyclical actor in the tradeŽvolume slowdown since 200ƒ is that economic recent slowdown… growth in many emerging marets has been wea relative to the previous two decades… eopolitical tensions‰ exchange rate luctuations‰ and the holding o o investments because o an uncertain outloo has also contributed to lower lows… 11 rwin‰ op… cit… Swiss Re sigma No 3/2016 1ƒ
Žloƒal trade and insurance ar„et growt‚ Figure 1 25 lobal exports in ‹„ trillion 20 15 10 5 0 19801982 1984 19861988 1990 1992 19941996 1998 20002002 2004 2006 20082010 2012 2014 Services exports Agriculture Fuels and mining Manufactures „ource“ ŒT¢‰ „wiss ˜e Economic ˜esearch ™ —onsulting… Structural factors The slowdown in global trade is based The recent slowdown in trade relative to € growth results rom sluggishness in on sluggishness in trade o goods… Trade trade o goods‰ in particular in manuacturing‰ uel and mining products… ¦y contrast in services continues to exceed income trade in services is still growing at a much higher rate than global €… ‘owever‰ as growth… ¥igure 16 shows‰ services still account only or about one ith o global trade… The slowdown in global trade‰ thereore‰ is about structural changes in the production and trade o goods rather than services… The expansion o international supply The rapid expansion o international production networs/supply chains is an chains was an important driver o global important actor in explaining the outperormance o trade relative to income growth 12 trade in the two decades prior to the in the two decades prior to 200ƒ… Trade is measured on a gross value basis… a midŽ2000s… good which consists to a large part o imported intermediate goods is exported‰ the imported intermediate goods are recorded again in a country’s exports… n contrast‰ € only measures the value added in the exporter country… ‘ence‰ in the years beore 200ƒ‰ the rise o global value chains led to a large increase in the tradeŽtoŽ € ratio… ¢shoring is a tradeŽo between ccording to theory‰ the undamental tradeŽo in supply chain dispersion is between 13 specialisation gains and coordination specialisation gains and coordination costs… The revolution in inormation and costs… communication technology radically lowered coordination costs in the 1¡¡0s and early 2000s… ‘owever‰ the recent slowdown in oshore activities indicates that a urther substantial reduction in communication costs might be hard to achieve… n addition‰ narrowing wage gaps between countries lie —hina and advanced 1’ economies could lower specialisation gains… —onstantinescu et al… ind evidence that the slowing pace o international vertical speciali§ation might be another structural change aecting the tradeŽtoŽincome relationship… The E—¦ supports this inding by presenting evidence rom the Œorld nputŽ¢utput atabase… The share o oreign value added in gross exports increased until 200‰ and has remained broadly unchanged since 200¡… ‘igh wages in some emerging marets appear to be reducing dependence on oreign supply chains as manuacturers shit production bac to their home country… 12 … aulier‰ … „antoni‰ … Taglioni et al…‰ “The power o a ew in determining trade acceleration and slowdowns” in ¦… ‘oeman †ed‡… Te loal Trade lowdown €ew €ormal?, ¨oxE‹ ¦oo‰ 201… 13 ˜… ¦aldwin‰ “lobal supply chains“ Œhy they emerged‰ why they matter‰ and where they are going”‰ C‚PR ƒiscussion Paers, vol ¡103‰ 2012… 14 —… —onstantinescu‰ … ‚attoo and ‚… ˜uta‰ op… cit… 1 Swiss Re sigma No 3/2016
ˆn important structural actor is China’s There is a general consensus that developments in China have contributed to both transition rom an e€port-led to a the large increase in the trade-to-income ratio in the high-trade growth period prior consumption driven growth model to 200 and also to the ratio’s decline during the trade slowdown o more recent 1 and the declining import content o its ears rior to the mid-2000s China’s e€port-led growth model was a main driver 16 e€ports o global trade volumes ‚oreover ƒaulier et al argue that China’s economic integration also had a “…uggernaut eect” on trade liberalisation in ‡outheast ˆsian countries – ie a virtuous ccle in which trade liberalisation strengthens the e€port sector which in turn lobbies or urther trade liberalisation Šith China’s transition rom an e€port- and investment-led to a more consumption and service-based growth model a large driver o global trade growth has diminished The rebalanced Chinese econom with a higher emphasis on growth in the less trade-intensive service sector and domestic consumption will contribute less to global trade 1 ‹urther Constantinescu et al state that the share o Chinese imports o parts and components in its total e€ports has declined rom a peaŒ o Ž in the mid-1990s to around 3 Ž currentl China’s increasing abilit to source rom itsel has contributed to the sluggish development o the global trade-to-ƒ‘ ratio in recent ears Figure 17 16 ˆverage import taris or dierent 14 regions in Ž 12 10 8 6 4 2 0 1 3 5 7 3 5 9 11 13 9 9 9 9 999 01 0 0 07 0 0 0 19 19 19 19 1 0 0 2 2 2 20 20 2 20 World North America Europe Middle East Asia ‡ource’ Šorld “anŒ ‡wiss ”e •conomic ”esearch – Consulting «arge trade liberali™ation deals supported The •C“ claims that protectionism ma be plaing “a small but non-negligible role” 1— the increase in the trade-to-income ratio in the most recent trade slowdown ˜owever even a stagnating level o trade during the 1990s and earl 2000s but liberalisation would not drive the trade-to-ƒ‘ ratio higher ‹igure 1 shows the there have been ew notable agreements average import taris in percentage points or dierent regions since the earl 1990s recentl ‘uring this period in which global trade volumes grew twice as ast as output average taris across the world ell signiicantl ˆverage taris levelled o at low levels in the ears ater the inancial crisis and an urther declines ma onl have a marginal impact The stagnation in liberali™ation initiatives since the mid-2000s ma have also slowed trade growth relative to output ‹uture prospects and implications or growth œn coming ears trade will most liŒel There is no agreement on the relative importance o cclical versus structural actors not increase twice as ast as ƒ‘ in trade growth but there is strong evidence that both are at pla ˆmong others 19 “o™ et al argue that on balance cclical orces have been more important ˜owever ƒaulier et al20 and others argue that structural changes were responsible or a signiicant part o the recent slowdown ƒlobal trade should picŒ up again once global economic activit accelerates but is unliŒel to return to double-ƒ‘-growth 15 œbid 16 ƒ ƒaulier ƒ ‡antoni ‘ Taglioni op cit 17 C Constantinescu ˆ ‚attoo and ‚ ”uta op cit 18 “¢nderstanding the weaŒness in world trade” ECB Economic Bulletin, vol 3 201 19 • “o™ ‚ “ussière and C ‚arsilli “”ecent slowdown in global trade’ Cclical or structural¥” in “ ˜oeŒman ¦ed§ The Global Trade Slowdown: A New Normal? ¨o€•¢ “ooŒ 201 20 ƒ ƒaulier ƒ ‡antoni ‘ Taglioni op cit Swiss Re sigma No 3/2016 19
Žloƒal trade and insurance ar„et growt‚ rates… —hanges in underlying actors causing the recent decline o the tradeŽtoŽ€ ratio are liely to persist“ —hina’s transition to a more consumption and serviceŽdriven growth model will proceed‰ and gains rom urther international dispersion o production networs may have peaed… T€€ and TT€ might be a source or a t is unclear whether protectionism or trade liberali§ation measures will gain the renewed boost to the tradeŽtoŽ€ ratio… upper hand in the years to come… The TransŽ€aciic €artnership †T€€‡ reached agreement in ¢ctober 201‰ but the accord still needs to be signed and ratiied by participating countries… t should positively aect the tradeŽtoŽ€ ratio‰ although estimates on the potential impact on trade volumes and economic growth vary greatly… proposed Transatlantic Trade and nvestment €artnership †TT€‡ between the ‹„ and the E‹ is still being negotiated… Œhen and in what orm the agreement will come into orce is uncertain… Œea global trade growth will liely No current academic literature explicitly investigates the impact o the recent global dampen global economic growth… trade slowdown on global growth… ¦ut there is a large body o literature lining increases in productivity to trade in general‰ and to various aspects o dispersing the global value chain in particular…21 This material says a stagnating or decreasing tradeŽ toŽ€ ratio may have a negative eect on global growth as trade is a channel or nowledge transer and diusion o technologies‰ as well as or speciali§ation and resource allocation according to the theory o comparative advantage… mplications or insurance ˜ates determine marine insurance €remium rates tend to be cyclical‰ and are the most important determinant o marine premiums in the short run… Trade and credit insurance premiums in the short run… ‘owever‰ over the longer term‰ activities are the main determinant o premiums are mostly determined by the level o insurance exposure… persistent premiums in the long run… slowdown in global exports would directly lower exposure growth and would thereore have a negative impact on marine and credit insurance premiums… Taƒle 1 Long-run res‡onse ’ erage real Ž“† †ro”ected a erage real ‡reiu growt‚ if trade: „cenarios or the development o marine of ‡reius to trade growt‚ forecast o er grows in tande wit‚ grows twice as fast as premiums over the next 10 years t‚e net 10 €ears real Ž“† real Ž“† —argo 0…¡ 2…ˆ 2…ˆ …0ˆ ‘ull 0…0 2…2ˆ ’…’ˆ „ource“ ‚¥ Œorld Economic ¢utloo‰ „wiss ˜e Economic ˜esearch ™ —onsulting… 22 ‘arine insurance ˜ising trade activity increases cargo and ata rom the last two decades reveals that an increase o trade activity by 1ˆ hull premiums‰ but not by as much as the eventually leads to an increase in cargo premiums o slightly below 0…¡ˆ‰ and to increase in trade… an increase in hull premiums o about 0…ˆ… ¢ver the last 20 years‰ this longŽrun response o premiums to the value o traded goods has tended to be below 1…0… The reason might be ound by commercial pressures in the shipping industry… —redit availability and overly optimistic trade growth proŠections led to substantially increased orders or new ships rom 200’ to 200… The overhang o shipping capacity and resulting wea prices in maritime reight marets put pressure on premium rates… lso‰ saety may be rising‰ lowering the ris and the premium rates… trend towards larger ships has ept Œhile cargo premiums can be directly lined to the value o traded goods‰ trade only average hull premium below cargo indirectly aects hull premiums through the assumption that the global value o ships premium growth rates… is connected to the total value o its cargo… The excess supply o shipping capacity 21 „ee ‚… miti and •… –onings‰ “Trade ”iberali§ation‰ ntermediate nputs‰ and €roductivity“ Evidence rom ndonesia”‰ merican ‚conomic Review‰ vol ¡ƒ‰ no 200ƒ‰ pp 1611–163… lso €… –… oldberg‰ … –… –handelwal‰ N… €avcni et al…‰ “mported ntermediate nputs and omestic €roduct rowth“ Evidence rom ndia”‰ …uarterly †ournal of ‚conomics‰ vol 12‰ no ’ 2010‰ pp 1ƒ2ƒ–1ƒ6ƒ‰ and … ‚… rossman and E… ˜ossiŽ‘ansberg‰ “Trading Tass“ „imple Theory o ¢shoring…” merican ‚conomic Review‰ vol ¡‰ no 200‰ pp 1¡ƒ–¡ƒ… 22 The econometric analyses in this chapter ollows the methodology used in sigma ’/2013“ Navigating recent developments in marine and airline insurance‰ „wiss ˜e… 20 Swiss Re sigma No 3/2016
led to a decrease in ships’ market value. This and a trend towards larger ships, carring more cargo or less cost, might also eplain the lower longrun response o hull premiums to trade relative to cargo premiums. ™ongrun premium growth orecasts are sing an eternal orecast or gloal real € growth, Tale 1 presents two scenarios highl dependent on the uture path o or average real growth rates o cargo and hull premiums over the net 10 ears‚ tradeto € ratio. an upside scenario in which trade is assumed to grow twice as ast as € as during the period etween 1ƒƒ0 and 200„… and a downside scenario in which trade is assumed to grow at the same pace as gloal €. †rom these scenarios, cargo premiums are orecast to grow on average etween 2.‡ˆ and ‡ˆ, and hull premiums etween 2.2ˆ and ‰.‰ˆ. Šhile shortrun prospects o marine premiums are mainl driven the development o premium rates, long run prospects are highl dependent on the uture development o the tradeto € ratio. Trade credit insurance23 “igher eports tpicall lead to an sing historical data rom ‰0 countries, an evaluation was conducted o the eect increase in trade credit insurance o eports on trade credit insurance premiums. The analsis estimates that a 1ˆ premiums. increase in eports is accompanied a 0.6„ˆ increase in trade credit insurance premiums. Trade credit insurance protects sellers o products and services against the risk o nonpament the uer. ‹ince this also includes domestic uers, eport data onl capture a part o the eposure to nonpament. The rest o the eposure depends on the development o the economic activit within a countr, which in turn also aects trade. Œter controlling or these eects Žie, keeping the level o gloal economic activit constant‘, the analsis shows that a 1ˆ increase o trade results in a ’ust 0.32ˆ increase in trade credit insurance premiums. “owever, that is still signiicant. ”oreover, as with the analsis on the impact o trade on marine lines, the estimates do not account or a possile negative impact o a gloal trade slowdown on economic activit. Conclusion —ver the net decade, marine and trade The longrun prospects o marine and trade credit insurance lines are signiicantl credit insurance premiums are likel to aected the development o the tradeto € ratio. This ratio should pick up in develop more modestl than previousl. the coming ears as the gloal econom recovers. “owever, the recent slowdown in trade growth also relects, to a certain etent, permanent structural changes in the gloal econom. ”ost o the mentioned actors are likel to persist, pointing to more modest development o marine and trade credit insurance premiums than would have een epected several ears ago using onl real € growth rates. 23 †or an economic analsis o the trade credit insurance market, see Trade credit insurance & surety: taking stock after the financial crisis, —ctoer 201‰, ‹wiss ˜e. Swiss Re sigma No 3/2016 21
dvanced maret premiums grow aster than € lobal share o advanced marets declined to 1…3ˆ in 201 dvanced countries continued to lose Total premiums in the advanced marets grew by 2…ˆ in 201‰ little changed rom global insurance maret share in 201 the previous year… n nominal ‹„ terms‰ however‰ premiums declined by …ƒˆ to due to exchange rate depreciation… ‹„ 3 ƒ0’ billion due to widespread exchange rate depreciation‰ particularly in the euro §one‰ ustralia and —anada… Exchange rate weaness against a resilient —hinese renminbi also contributed to the decline in the advanced marets’ share o global insurance premiums to 1…3ˆ †201’“ 2…6ˆ‡… Life insurance ”ie insurance premiums grew slightly Total lie premiums in the advanced marets grew by 2…ˆ in 201‰ outpacing € aster than the economy‰ … growth slightly and increasing insurance penetration marginally †premiums/€‡… n 1ƒ o the 2 marets or which data are available †see ¥igure 1 in which the blue dots above the line indicate premium growth above € growth‡‰ lie premiums growth outpaced economic growth… Figure 1 20€ ”ie and nonŽlie premium growth versus € growth in the advanced marets‰ 201 15€ ingapore 5 10€ 1 Finland ong ong weden 0 Portugal h 2 5€ wt o r 0€ pain Greece emium g5€ eal pr10€ Netherlands ustralia R Luemourg 15€ 20€ Portugal 0‚5€ 0€ 0‚5€ 1‚5€ 2‚5€ ƒ‚5€ „‚5€ Real GDP growth 2015 Life insurance Non-life insurance GDP growth e ual to premium growth „ource“ „wiss ˜e Economic ˜esearch ™ —onsulting… Non-life insurance … as did nonŽlie premiums… n nonŽlie‰ total premiums in the advanced marets grew by 2…6ˆ in 201‰ also more than the overall economy… €remium growth was stronger than € growth in 16 o the 2 marets with data… 22 Swiss Re sigma No 3/2016
‰nsurance ‡enetration and densit€ €er capita spending on insurance in n 201‰ average per capita spending on insurance in advanced marets was advanced marets decreased in 201… ‹„ 3’’0‰ down almost 6ˆ rom the previous year due primarily to exchange rate movements… €er capita spending on lie insurance was ‹„ 1¡’ and in nonŽlie it was ‹„ 1’6… €enetration remained at the same level since it is unaected by exchange rate movements… Figure 1‹ nsurance density and penetration in advanced marets‰ 201 Premiums in USD 0 1000 2000 3000 4000 5000 6000 7000 8000 Switzerland Hong Kong Luxembourg Finland Denmark Netherlands United Kingdom United States Taiwan Ireland Singapore G7 Norway Japan Average Sweden France Canada South Korea Australia EU, 15 countries Belgium Italy Germany Austria New Zealand Israel Portugal Spain Iceland Malta Cyprus Greece 0% 5% 10% 15% 20% Premiums as a % of GDP Non-life premiums per capita Life premiums per capita Total insurance penetration (lower axis) „ource“ „wiss ˜e Economic ˜esearch ™ —onsulting… Swiss Re sigma No 3/2016 23
’d anced ar„et ‡reius grow faster t‚an Ž“† North merica“ lie premiums rebound‰ nonŽlie growth strengthens Life insurance ”ie premiums in the ‹„ rebounded in n the ‹„‰ lie premiums rebounded by 3…¡ˆ in 201 †201’“ –2…0ˆ‡… ndividual lie 201‰ driven by stronger group and business advanced at a healthy pace‰ driven by robust increases in universal lie and individual lie sales… whole lie sales due to attractive product guarantees… ter two years o declines‰ premiums in the group lie and annuity segment surged‰ supported by stronger income and employment growth… ”ow interest rates and returns rom alternative investments led to lower investment yields… n addition‰ actuarial reviews led to lower interest rate assumptions and conse«uent reserve increases… The industry’s ˜¢E‰ at 11ˆ‰ was unchanged and still short o preŽcrisis levels o around 1ˆ… —apital levels remained solid at most companies… n —anada‰ macroeconomic headwinds intensiied with premium growth slowing to 2…¡ˆ in 201… roup sales remained strong‰ and new individual protection products contributed to growth †eg‰ universal lie products‡… Œhole lie policies also remained attractive‰ particularly participating policies… ndividual annuities contracted due to adverse inancial marets which also pressured lie insurers’ investment income‰ dragging ˜¢E to …ˆ †201’“ 11…6ˆ‡… This year‰ ‹„ lie insurer proitability n the ‹„‰ growing employment and consumer spending should support demand or will remain under pressure… insurance in 2016… Œith interest rates expected to remain low and inancial maret volatility to linger‰ industry proitability will remain under pressure… ”ie insurers will continue to ocus on improving capital management‰ lowering expenses and enhancing investment yields… n —anada‰ premium growth should improve alongside the economy and reach trend growth in 201ƒ… €roitability will remain stable and capitali§ation solid… new capital ramewor expected in midŽ2016 †implementation in 201‡ is not expected to change the assessment o industry capitali§ation… Non-life insurance NonŽlie premiums continued to grow in n the ‹„‰ nonŽlie premiums grew by 3…1ˆ in 201‰ despite a still sot pricing the ‹„ and —anada in 201‰ despite sot environment… rowth was strongest in commercial auto and inland marine‰ ollowed pricing in the ‹„… by general liability and worers compensation… ‘owever‰ overall premiums in personal lines grew more strongly than in commercial lines‰ with pricing down in the Nort‚ ’erica ‡reius• 2015 latter… ccident and health † ™‘‡ premiums grew only slowly ater a steep drop in Œorld 201’ due to a reclassiication o a company as a health insurer… €roitability beneited ‹„ bn maret share rom reserves releases‰ though at a slower pace than in the previous year‰ and rom ”ie 602 2’ˆ benign catastrophe losses‰ but investment income stagnated… ¢verall sector ˜¢E NonŽlie 2¡ ’1ˆ declined to 6…¡ˆ in 201… n —anada‰ nonŽlie premiums grew by ’…2ˆ in 201‰ up rom 1…3ˆ growth in 201’‰ despite economic headwinds… ‚ost maŠor lines 5% Real premium growth contributed‰ but liability and property premiums were particularly strong‰ supported by select rate increases‰ as were ™‘ premiums… ‚otor premiums grew slower than 4% the total but aster than in 201’‰ as reorms in ¢ntario continued to weigh… 3% ‹nderwriting proits o —anadian nonŽlie insurers were supported by accelerating 2% premium growth and lac o any maŠor catastrophe activity… —oupled with a moderate investment result‰ industry ˜¢E improved to 11…’ˆ rom 10…6ˆ in 201’… 1% 0% rowth o ‹„ nonŽlie premiums is expected to slow slightly in 2016 and 201ƒ in the ace o ongoing pricing pressures… ˜ates are expected to weaen in most commercial –1% lines and even become negative or several lines… n improving economy and rising –2% inlation will liely reduce the eect o reserves releases and possibly turn to reserve –3% strengthening in 201ƒ… ˜¢E is expected to continue to all due to sotening rates and LifeNon-life the low interest rate environment‰ and assuming normal catastrophe activity… €remium growth in —anada is expected to slow in 2016 relecting the modest Growth rate 2015 economic bacdrop‰ beore slowly picing up in 201ƒ and beyond… ndustry Pre-crisis average growth 2003–2007 proitability will liely also ease slightly… Post-crisis average growth 2009–2014 2’ Swiss Re sigma No 3/2016
Œestern Europe“ lie premiums slow‰ nonŽlie returns to growth Life insurance ”ie premiums in Œestern Europe grew n Œestern Europe‰ growth in lie insurance premiums slowed to 1…3ˆ in 201 rom by 1…3ˆ to ‹„ ƒ billion in 201… …ˆ in 201’… This was largely due to contraction in ermany †–2…ˆ‡‰ where new business ell in both regular †–3ˆ‡ and single premiums †–…ˆ‡… The ‹– lie maret returned to positive growth †£2…’ˆ‡‰ ater two years o premium declines… n particular‰ sales o investment and savings business is growing again… €remiums in ¥rance grew by 2…¡ˆ… n taly growth lattened ater two years o strong growth as sales o endowments slowed… sharp decline †–1ˆ‡ in premium income in €ortugal reversed some o the strong growth o the previous two years… The maret in „pain grew by £3…’ˆ‰ mainly driven by traditional lie and death beneit protection products… ‹nitŽlined business continued to contract… mong the ¦enelux countries‰ the biggest premium decline †–11ˆ‡ was in ”uxembourg where a volatile growth pattern rom the past ew years continued… The conidence crisis in the utch maret because o misŽselling continued or a ourth year running‰ with premiums down …ƒˆ… n ¦elgium‰ lie premiums were down ’…¡ˆ in 201… The Nordic marets grew by …¡ˆ †„weden‡‰ ƒ…6ˆ †¥inland‡‰ and 2…2ˆ †enmar‡… The ˜¢E o a sample seven European lobals2’ decreased to …6ˆ rom ¡…ˆ in 201’ indicating a lower proitability… ˜¢E or a sample o 6 ‹– companies was 20ˆ…2 The nearŽterm outloo or lie insurers is The shortŽterm outloo or the lie industry in Œestern Europe is blea‰ in part due to subdued… the pending ‹– reerendum on E‹ membership… iven that it is the largest maret in Œestern Europe‰ the outcome o the vote could have signiicant implications or the ‹– maret itsel… ‚ore generally‰ the low interest rate environment will continue to constrain demand or lie insurance as well as sector proitability… ¢n the other hand‰ the aging population in Œestern Europe should generate increased demand or protection‰ savings and retirement products in the longer term… Non-life insurance NonŽlie premium growth in Œestern NonŽlie premium growth in Œestern Europe was a moderate 1…ˆ in 201‰ still well Europe gained pace in 201… below the preŽcrisis average‰ but a big improvement on the 0…2ˆ postŽcrisis average… ermany‰ the ‹– and ¥rance recorded premium volume increases o 2…0ˆ‰ 1…ˆ and Western uro‡e ‡reius• 2015 1…ˆ‰ respectively… n ermany‰ motor and property lines registered solid growth‰ Œorld while ™‘ and liability premiums declined in real terms… n the ‹–‰ premium growth ‹„ bn maret share was up again on the bac o rate improvements… The ¥rench maret was mainly ”ie ƒ 3’ˆ driven by household insurance †£3…ˆ‡… ‚otor insurance expanded due to strong NonŽlie ¡ 2ˆ new car registrations but a new consumer protection law †”oi ‘amon‡ which maes switching insurance policies easier‰ intensiied competition… The Nordic marets Real premium growth were mixed… mong the southern E‹ countries‰ growth was strong again in „pain 7% and €ortugal‰ but reece continued to decline †–6…0ˆ‡… n taly premiums ell 2…ƒˆ‰ % driven by a 6…ˆ all in motor liability‰ relecting a all in new car sales… 5% vailable inormation suggests a 1–2 ppt weaening o underwriting proitability in 4% nonŽlie in Œestern Europe in 201… The average combined ratio o the our largest 3% marets †¥rance‰ ermany‰ taly and the ‹–‡ was around ¡¡ˆ… ˜eserve releases 2% continued‰ but at a reduced pace… ‹nderwriting results deteriorated or motor †ermany‰ taly‡ and commercial insurance †¥rance‰ ermany‡‰ and due to loods in 1% the ‹–… NonŽlie premium growth in Œestern Europe will remain subdued in light o 0% the moderate economic recovery… ‹nderwriting proitability is expected to LifeNon-life deteriorate as a result o soter rates in commercial lines and motor insurance‰ while Growth rate 2015 claims growth will remain moderate… €roitability will remain under pressure due to stillŽlow investment yields… Pre-crisis average growth 2003–2007 Post-crisis average growth 2009–2014 24 llian§‰ ® ‰ —N€‰ enerali‰ „T¢˜E¦˜ N „ ‰ „wiss ”ie and ¹urich… 25 viva‰ ”egal ™ eneral‰ ¢ld ‚utual‰ €rudential †‹–‡‰ „t… •ames €lace‰ and „tandard ”ie… Swiss Re sigma No 3/2016 2
erging regions continue to gain ar„et s‚are dvanced sia“ steady expansion in lie and nonŽlie Life insurance ”ie premiums grew by ’…2ˆ in the ”ie insurance premiums in advanced sia grew by ’…2ˆ in 201‰ ater a 3…3ˆŽgain advanced sian marets in 201… in the previous year… The improvement was driven by acceleration in •apan‰ with premium growth up 2…ˆ rom 1…3ˆ in 201’… This more than compensated or a slowdown in „ingapore to a still solid ¡…ˆ… †201’“ 1’ˆ‡ The slowdown was mostly due to slower sales o single premium lined policies‰ but the maret continued to beneit rom increased transparency and the lower distribution costs resulting rom the irect €urchase nsurance initiative… ‚eanwhile‰ sales remained robust and stable in ‘ong –ong‰ „outh –orea and Taiwan… n •apan‰ improved sales o traditional individual lie products helped oset sluggish demand or annuity products… ‘ong –ong has continued to beneit rom new business sales to visitors rom mainland —hina‰ which accounted or 2’ˆ o total new premiums rom individual lie savings business in 201… n Taiwan‰ there was a recovery in individual annuity sales and in „outh –orea‰ robust sales o protection products underpinned overall premium growth… ”ow interest rates have again raised €rolonged low interest rates has put pressure on lie insurers’ investment returns and concerns about negative spreads … proitability… To counter low returns at home‰ •apanese lie insurers have increased holding o oreign securities… t the same time‰ insurers have sought to lower operational expenses‰ particularly in •apan‰ „outh –orea and Taiwan where insurers ace deepening negative interest rate spreads †maret interest rates are lower than the guaranteed interest rates o policies‡… … and also about insurers’ ability to oer The nearŽterm growth outloo or lie insurance in advanced sia remains uncertain‰ attractive returns to consumers… as low interest rates continue to threaten insurers’ ability to oer attractive returns… This is the case in „outh –orea and Taiwan‰ and even more so in •apan where the central ban has adopted a negative interest rate regime… n ‘ong –ong‰ tightening rules on overseas payments through credit cards‰ and regulator concerns in mainland —hina about currency and claims riss o mainland —hinese purchasing insurance in ‘ong –ong‰ could constrain insurance sales to —hina visitors… Non-life insurance NonŽlie premium growth was stable in NonŽlie premium growth in advanced sia was stronger in 201 than in 201’ 201‰ but proitability was weaer… †£’…1ˆ and £3…’ˆ‰ respectively‡… n •apan‰ premiums rose 3…1ˆ †201’“ 3…¡ˆ‡ rom strong demand or ire cover ahead o rate hies and product revisions in ¢ctober ’d anced ’sia ‡reius• 2015 201… t the same time‰ rate increases pushed motor premiums higher while Œorld personal accident business ell… „tronger growth in ™‘ underpinned a recovery in ‹„ bn maret share ‘ong –ong‰ while in „ingapore growth derived support rom robust expansion in the ”ie ƒ¡ 23ˆ health‰ ire and marine lines… €remium growth in Taiwan was airly broadŽbased NonŽlie 1¡’ 10ˆ across business lines while –orea’s nonŽlie sector beneitted rom rate hies in the motor and health segments… €roitability is estimated to have deteriorated in the Real premium growth advanced sian marets… ‘igher loss ratios were reported in most marets with the 5% exception o „ingapore‰ but there proitability was undermined by higher expenses 4% and low investment returns… n •apan‰ proitability was aected by higher losses rom 3% natural catastrophes in 201‰ including the Typhoons oni and Etau… —ombined insured losses rom the two events are estimated at ‹„ 1… billion… 2% 1% Œeaening economic growth will remain a ey challenge or the nonŽlie sector in 0% advanced sia… The boost rom motor premium rates will begin to ade in 2016‰ while motor vehicles sales liely remain wea… ¢n the other hand‰ growth is expected –1% to remain strong in ™‘‰ partly due to increasing awareness and also product reŽ LifeNon-life pricing‰ or example in „outh –orea… Growth rate 2015 Pre-crisis average growth 2003–2007 Post-crisis average growth 2009–2014 26 Swiss Re sigma No 3/2016
¢ceania“ contracting lie and stable nonŽlie Life insurance ”ie premium growth in ¢ceania in 201 Total lie premiums in ¢ceania contracted by ƒ…ˆ in 201‰ ater strong growth o was dragged down by poor sales o 2ƒ…ˆ in 201’… The main drag was ustralia‰ where premium income ell …1ˆ due investmentŽlined and disability products to volatility in investmentŽlined products and a poor perormance o disability and in ustralia… income protection products… ‹nderwriting perormance improved ater maŠor insurers raised rates on income protection products by a urther –10ˆ ater an aggressive repricing in 201’… ustralian lie insurers’ net ater tax proit rose 10ˆ in 201 and the industry’s capital base remains strong… n New ¹ealand‰ lie premiums grew by 1…ˆ in 201 †201’“ £’…ˆ‡… n increase in sales o trauma insurance and income protectionŽtype products was partly oset by a continued decline in sales o whole lie‰ endowment and unbundled traditional products… The lie sector is expected to resume The lie sector in ¢ceania is expected to return to growth in 2016… n ustralia‰ an moderate premium growth in 2016… improving economy will liely lend support‰ but the unemployment rate remains high and strained household budgets could weigh on insurance demand… ncreased rates or income protection products should support underwriting proits‰ but worsening claims and lapse rates remain a concern… ‚eanwhile‰ regulations are increasingly ocused on consumer protection‰ which could impact insurance distribution… n •une 201‰ the ustralian government gave support to the maŠority o the ¥inancial „ystem n«uiry’s recommendations‰ including restricting upront insurance commissions to agents/advisors… The New ¹ealand government is also reviewing the ¥inancial dvisers ct and the ¥inancial „ervice €roviders ct‰ to either ban or cap commissions or insurance broers and advisers… Non-life insurance NonŽlie premiums grew steadily in NonŽlie insurance premium growth in ¢ceania was lat in 201‰ ater 1…1ˆ growth in personal lines but were sluggish in 201’… n ustralia‰ premiums grew 0…ˆ †201’“ £1…3ˆ‡… There was wea growth in commercial lines… commercial lines overall… n particular‰ liability lines were sluggish and property –ceania ‡reius• 2015 premiums declined… n comparison‰ maŠor personal lines – including property and Œorld motor – recorded moderate growth… ¢verall‰ gross claims incurred rose in 201‰ due ‹„ bn maret share mainly to losses rom a number o natural catastrophe events including —yclone ”ie ’ 1…ˆ ‚arcia‰ heavy storms in New „outh Œales and „outh East ·ueensland‰ hailstorms in NonŽlie 3 1…ƒˆ „ydney and bushires in „outh ustralia… Total claims rom these events were ‹ 2…2 billion †as o November 201‡‰ according to estimates by the nsurance —ouncil 4% Real premium growth o ustralia… The overall loss ratio rose to 6¡…2ˆ in 201 rom 63…2ˆ in 201’… longside higher losses rom natural catastrophes and weaer investment results‰ 2% ustralia’s nonŽlie insurers reported a ’3ˆ drop in aterŽtax net proits… NonŽlie 0% direct insurers’ solvency ratio declined slightly in 201‰ but was still strong… n New –2% ¹ealand‰ nonŽlie insurance premiums are estimated to have declined by 1…2ˆ †201’“ £0…2ˆ‡‰ relecting a wea economic bacdrop… ¦y line o business‰ property –4% premiums contracted due to ierce price competition‰ motor was steady‰ and liability –% lines were mixed… The loss ratio is estimated to have improved‰ relecting benign –% natural catastrophe losses and lower liabilities claims… –10% NonŽlie insurers still ace pricing pressures‰ and premium growth in ¢ceania is LifeNon-life expected to remain low in 2016… n addition‰ an expansive range o regulatory Growth rate 2015 changes present maŠor challenges… ¥or example‰ the ustralian government Pre-crisis average growth 2003–2007 established the Northern ustralia nsurance €remiums Tasorce to explore options Post-crisis average growth 2009–2014 to reduce home‰ contents and strata insurance †general insurance or common and/ or shared property‡ premium rates… n New ¹ealand‰ the government has proposed increasing the limit o building cover by the Earth«uae —ommission †E·—‡… s E·— insures property on a irstŽloss basis‰ the rise in insured limits could crowd out private nonŽlie insurers oering excess covers… Swiss Re sigma No 3/2016 2ƒ
Emerging marets continue to gain global share nsurance maret expansion advances urther €remium growth in the emerging Total insurance premiums written in the emerging marets in 201 rose by ¡…ˆ to marets remained strong in 201… ‹„ 0 billion‰ and premium growth continued to outpace € growth… The global share o emerging maret premiums grew by 1…2 ppt to 1…ƒˆ‰ helped by exchange rate weaness in the maŠor advanced economies… „ince 2006‰ insurance sector growth in the emerging marets has outpaced economic growth by a actor o more than 1…… Excluding —hina‰ however‰ this actor was signiicantly lower as insurance maret growth was only 1…1 times higher than economic growth… Life insurance ”ie insurance penetration continued to ”ie premiums in the emerging marets overall grew by 12ˆ in 201‰ well above increase in 201… economic growth o 3…ˆ… €remium growth was stronger than economic growth in ’1 o the 1 marets or which data are available… n ¥igure 20‰ the blue dots above the line represent those marets where premium growth exceeded € growth last year‰ meaning an increase in insurance penetration… Figure 20 25€ ”ie and nonŽlie premium growth versus € growth in emerging marets‰ 201 15€ 5 rail 1 0 5€ h 2 0€ Russia wt o r 5€ eneuela cuaor emium g 15€ eal pr R 25€ Ukraine 5€ 1€ ‚€ € 0€ € ‚€ Real GDP growth 2015 Life insurance Non-life insurance GDP growth eual to premium growth „ource“ „wiss ˜e Economic ˜esearch ™ —onsulting… Non-life €remium growth in the nonŽlie sector NonŽlie premiums in the emerging marets overall grew by ƒ…ˆ in 201‰ still solid was slower than in lie… despite a wea economic environment… t the country level‰ insurance penetration increased in 3’ o the 2 marets or which 201 data are available… ‰nsurance ‡enetration and densit€ €er capita spending on insurance in the verage per capita spending on insurance in emerging marets remained little emerging marets was unchanged in changed at ‹„ 13 in 201‰ o which ‹„ ƒ1 went to lie insurance and ‹„ 6’ 201‰ but penetration increased… to nonŽlie… The average insurance penetration in emerging marets increased to 2…¡ˆ last year rom 2…ƒˆ in 201’… 2 Swiss Re sigma No 3/2016
Figure 21 nsurance density and penetration in emerging marets‰ 201 Premiums in USD 0 500 1000 1500 2000 2500 Macao Qatar United Arab Emirates Slovenia Trinidad and Tobago South Africa Chile Czech Republic Mauritius Bahrain Malaysia Argentina Slovakia Namibia Poland Uruguay Panama Brazil Thailand Saudi Arabia Hungary Croatia PR China Kuwait Lebanon Oman Venezuela Costa Rica Mexico Colombia Bulgaria Turkey Ecuador Average Russia Peru Romania Serbia Jordan Iran Morocco Dominican Republic Tunisia Kazakhstan Indonesia Philippines India Guatemala Sri Lanka Kenya Angola Vietnam Algeria Ukraine Egypt Pakistan Bangladesh Nigeria 0% 3% 6% 9% 12% 15% Premiums as a % of GDP Non-life premiums per capita Life premiums per capita Total insurance penetration (lower axis) „ource“ „wiss ˜e Economic ˜esearch ™ —onsulting… Swiss Re sigma No 3/2016 2¡
erging ar„ets continue to gain gloƒal s‚are Emerging sia“ healthy growth in lie and nonŽlie Life insurance ”ie premium growth in emerging sia espite economic headwinds‰ lie premiums in emerging sia grew aster in 201 accelerated last year‰ despite strong than in 201’‰ by 16ˆ against ¡…1ˆ… The improved perormance was in part due to economic headwinds… recovery in ndia and the €hilippines‰ and sustained strong expansion in ndonesia and ¨ietnam… n ndia‰ the recovery was underpinned by investmentŽlined products which posted strong growth through bancassurance channels… Nevertheless‰ the main contributor was —hina‰ where premium growth accelerated to 20ˆ in 201 rom 13ˆ a year earlier… This in turn was driven by insurers’ raising guarantee rates to compete with wealthŽmanagement products oered by bans‰ ater the regulator removed the interest rate cap on participating policies in ¢ctober 201… ¢verall sector proitability in emerging sia remained solid on lower realised losses‰ but lie insurers continue to ace the challenge o low interest rates… €remium growth is liely to remain The outloo or the lie sector in emerging sia remains avourable with premiums doubleŽdigit in 2016‰ but less than in orecast to maintain doubleŽdigit growth in 2016 and 201ƒ… n ndonesia and 201… ‚alaysia‰ insurers are increasingly ocused on the sharia compliant/taaul business‰ which has grown more strongly than conventional business in recent years… n —hina‰ the growth o lie premiums could slow rom last year’s high level as insurers become increasingly concerned about guarantees oered or products o longer durations… ˜ecent interest rate cuts in several countries including —hina‰ ndia‰ Thailand and ndonesia will put urther pressure on insurers’ proits… Non-life insurance NonŽlie premium growth was strong in NonŽlie premiums in emerging sia grew by 1ˆ in 201‰ compared with 1’ˆ in most emerging sian marets‰ with the 201’… €remium growth remained strong in —hina †£1ƒˆ‡‰ the second largest nonŽlie exception o ‚alaysia… maret in the world‰ driven by motor‰ guarantee ™ credit and agricultural insurance business… n most other emerging sian marets‰ in particular ndia‰ ndonesia and erging ’sia ‡reius• 2015 Thailand‰ premium growth improved rom a lat perormance the previous year… Œorld rowth in ndia was led by stronger health †including personal accident †€ ‡‡ and ‹„ bn maret share ‚T€” premiums… n ndonesia‰ a recovery in motor premiums was the main ”ie 312 12ˆ contributor‰ while in Thailand health insurance perormed well… n ‚alaysia on the NonŽlie 212 10ˆ other hand‰ nonŽlie premium growth stalled in 201 ater ’…3ˆ growth in 201’‰ mainly rom slower sales o motor vehicles… ‚eanwhile‰ underwriting perormance 20% Real premium growth largely remained satisactory in emerging sia in 201‰ particularly in —hina‰ ‚alaysia and the €hilippines‰ given an absence o signiicant natural catastrophe 18% losses… The explosion in TianŠin ports in ugust 201‰ while being the largest manŽ 15% made disasters in sia with an estimated property loss o ‹„ 2… billion to ‹„ 3… billion‰ had a limited impact on the proitability o —hina’s insurers partly due 13% to reinsurance recoverables… 10% 8% The region is expected to sustain robust premium growth in 2016 and 201ƒ… —hina‰ or instance‰ will beneit rom the government’s obŠective to raise total insurance 5% penetration to ˆ by 2020 rom 3ˆ in 201’… To this end‰ the government has 3% initiated policies to encourage the development o property natural catastrophe‰ 0% environmental liability and agricultural insurance‰ among others… „ustained Life, excl inrastructure investment in other marets will also support aggregate premium LifeNon-lifeNon-life, growth in the region… Nonetheless‰ ongoing motor deŽtariication in —hina could China excl China exert downward pressure on premium growth given that motor accounts or about Growth rate 2015 ƒ0ˆ o total nonŽlie premiums… Elsewhere‰ ‚alaysia is also preparing to liberalise Pre-crisis average growth 2003–200 motor taris in 2016‰ which could intensiy competition and suppress premium Post-crisis average growth 200–201 growth… n comparison‰ premium growth in ndia will beneit rom the hies in ‚T€” rates in pril 2016… ¢verall‰ nonŽlie proitability in sia will liely remain depressed due to the ongoing low interest rate environment and increasing price pressures in —hina and ‚alaysia due to motor deŽtariication… 30 Swiss Re sigma No 3/2016
”atin merica“ lie recovers‰ sotness in nonŽlie maret deepens Life insurance ”ie insurance premiums in ”atin merica ”ie insurance premiums in ”atin merica and the —aribbean grew by ƒ…ˆ in 201‰ grew by ƒ…ˆ in 201‰ more than double up rom 3…1ˆ in 201’ but still below the preŽinancial crisis average rate… The the rate in 201’… improvement largely relects robust growth in ¦ra§il and a strong rebound in —hile‰ mainly driven by savings products… There was a spie in und redemptions o the popular but volatile ¦ra§ilian lieŽsavings product †¨ida erador de ¦eneícios ”ivres‡ towards the end o 201’‰ and a recovery over the course o 201… n —hile‰ demand or annuities‰ the astestŽgrowing line o business‰ received a boost rom regulatory changes to the discount rate used or calculating associated re«uired reserves… This made annuities more attractive than the planned retirement alternatives operated by pension unds… ¢n the other hand‰ growth o ordinary lie insurance lines in ¦ra§il and —hile was muted‰ notably in creditŽlie… Elsewhere‰ there was improvement in ‚exico and recoveries in rgentina‰ Ecuador and —olombia †ater adŠusting or the base eect rom a large pension policy transer in 2013‡… ”ie insurance premium growth is ”ie premium growth in the region is proŠected to decelerate marginally in 2016… proŠected to decelerate in 2016… The products that uelled high growth in 201 in ¦ra§il and —hile are liely to lose momentum this year… n particular‰ annuities growth in —hile is expected to decelerate in the second hal o the year… New mortality tables will extend lie expectancy assessments‰ resulting in higher prices to mae up or smaller annuity payments… „tronger growth in rgentina and ‚exico should oer support‰ with macroŽeconomic stabilisation in the ormer and iscal incentives or longŽterm savings in the latter buoying demand… ‘owever‰ premium growth will remain below recent trend levels in the short to medium term… €rice competition‰ weaer demand and labour marets‰ and heightened inancial volatility will aect insuers in the region… Non-life insurance NonŽlie premiums in ”atin merica and NonŽlie premiums in ”atin merica and the —aribbean grew by 2…3ˆ in 201‰ down the —aribbean grew by only 2…3ˆ… rom 6…¡ˆ growth in 201’… rowth patterns varied widely among the maŠor marets‰ accelerating in rgentina‰ ‚exico and €eru‰ but contracting in ¨ene§uela and ¦ra§il… —hile and —olombia recorded slightly higher growth… n ¦ra§il‰ nonŽlie premiums Latin ’erica ‡reius• 2015 ell by 2…6ˆ‰ the weaest growth since 1¡¡6… The heaviest drag came rom motor‰ Œorld which ell by …¡ˆ due to a 2ƒˆŽdecline in car sales amidst a slump in consumer ‹„ bn maret share spending… ¦y contrast‰ record vehicle sales in ‚exico uelled robust motor premium ”ie 66 2…6ˆ growth in that maret‰ relecting stronger economic growth‰ curbs on used car NonŽlie ¡2 ’…ˆ imports‰ a consumer credit boom and a new re«uirement that all cars in the capital have thirdŽparty liability cover…26 ‚otor premiums in rgentina also surged in 201‰ Real premium growth largely due to rate increases to eep up with high claims growth… €roperty was the 9% main growth driver in —hile‰ the only maret in the region where property premiums 8% have a larger share than motor… emand or real estate surged in the inal «uarter o 7% 201 as consumers brought orward purchases ahead o tax hies and curbs on mortgage lending due to be phased in during 2016–201ƒ… 6% 5% ‹nderlying maret dynamics suggest that premiums will contract urther in ¦ra§il 4% and ¨ene§uela in 2016‰ while rgentine premium growth will slow substantially as the new government’s macroeconomic adŠustment measures begin in earnest… This 3% will be partly oset by slower but stable premium growth in ‚exico‰ —olombia‰ —hile 2% and €eru… ¥or the region as a whole‰ nonŽlie premiums are orecast to be lat in 2016 beore recovering gradually thereater… Tighter credit conditions‰ weaer economic 1% growth and less supportive economic policies will restrain insurance demand… 0% LifeNon-life Growth rate 2015 Pre-crisis averae rowth 2003–2007 Post-crisis averae rowth 2009–2014 26 ‚exican property premiums also increased signiicantly‰ although this was primarily due to the renewal o a multiŽyear policy with the state oil company €emex… Swiss Re sigma No 3/2016 31
erging ar„ets continue to gain gloƒal s‚are —entral and Eastern Europe“ diverging growth trends Life insurance ”ie premiums declined in —EE‰ driven by ”ie insurance premium growth in —EE declined or a third year running in 201‰ by €oland‰ but many marets continued to 3…ˆ ater a 2…0ˆ contraction in 201’… The main drag came rom the two largest improve… marets‰ €oland and —§ech ˜epublic… n €oland‰ premiums ell by ’…¡ˆ with the maŠority o the decline coming rom single premiums savings products due to the low interest rates and a new tax on interest payments or shortŽterm products to policyholders… nd in the —§ech ˜epublic‰ premiums ell 13ˆ as a removal o tax deductibility on single premiums made these less attractive… €remiums in ‘ungary and „lovaia also declined‰ but grew strongly in ˜omania‰ ¦ulgaria and „lovenia… espite a deep recession with surging inlation‰ premiums in ˜ussia grew 3…’ˆ in 201‰ but this was still much lower than the 1¡ˆ growth achieved in 201’ and 0ˆ in 2013‰ which was mainly driven by credit related products… €remiums continued to collapse in the ‹raine †–32ˆ‡ as surging inlation and the ˜ussia/‹raine conlict continued to aect the economy and insurance marets… The premium decline should halt in 2016 ”ie insurance premium growth will remain under pressure in most o —EE’s E‹ as economic growth continues… ‘owever‰ member states… ”ie insurance premiums could stabilise with continued strong savings products remain unattractive due growth… ‘owever‰ savings products will remain unattractive due to stillŽlow interest to low interest rates… rates… The €olish maret should beneit rom a strengthening economy‰ alling unemployment and rising disposable incomes‰ but the introduction o a new tax on ban and insurers’ assets could negatively impact demand and insurer proitability‰ depending on whether the cost can be passed on to consumers… n the —§ech ˜epublic and in ‘ungary‰ lie insurance premium growth will liely remain under pressure‰ with low interest rates continuing to discourage savings… ‘owever‰ in ‘ungary‰ the national ban is considering stricter ee limits on unitŽlined products in an attempt to ensure cost transparency or consumers‰ and this could provide a boost to lie insurance sales… €remiums in ˜ussia are expected to decline in 2016 due to ongoing economic diiculties resulting rom low oil prices‰ sanctions due to the ‹raine conlict‰ high inlation and declining real incomes… Non-life insurance NonŽlie premiums ell in ˜ussia and NonŽlie premiums in —EE declined by ’…¡ˆ in 201 †201’“ –1ˆ‡‰ almost exclusively ‹raine in 201… n almost all other —EE due to ˜ussia‰ the region’s largest maret‰ where premiums declined by 12ˆ as the countries‰ premiums were up… economy contracted… NonŽlie premiums also declined in the ‹raine †–2’ˆ‡‰ while almost all other —EE marets grew… Excluding ˜ussia and the ‹raine‰ —EE nonŽlie Œentral and astern uro‡e ‡reius• premiums were up 3…’ˆ in 201… €remiums in €oland‰ the second largest maret in 2015 the region‰ were up 2…1ˆ †compared to 0…3ˆ growth in 201’‡ as demand or and Œorld prices o motor insurance piced up‰ and liability insurance bounced bac strongly… ‹„ bn maret share ‚otor insurance boosted real premium growth in ‘ungary to 6…ƒˆ‰ as rates in motor ”ie 1 0…6ˆ increased… n the —§ech ˜epublic‰ real premiums grew by ’…ˆ‰ also supported by NonŽlie 3 1…¡ˆ motor cover sales… n „lovaia and „lovenia‰ nonŽlie premium growth was more muted at about 1ˆ… ‹nderwriting proitability in the —EE region overall remained 12% Real premium growth under pressure even though there were no maŠor natural catastrophes… 10% Economic recovery in —EE †excluding ˜ussia and ‹raine‡ is expected to continue in 8% 2016‰ leading to lower unemployment and increased consumption‰ and in turn 6% stronger premium growth… NonŽlie premiums in ˜ussia are expected to decline‰ with 4% the economy expected to contract again this year… n the ‹raine‰ insurance premiums are expected to decline also with little economic and political 2% improvement in sight… the ‹raine conlict were to be resolved and sanctions lited‰ 0% everyone‰ including nonŽlie insurers‰ would beneit rom the boost to economic growth… NonŽlie sector proitability in —EE will remain mixed… ˜egulatory changes‰ –2% such as the insurance tax in €oland‰ could hurt overall proitability… –4% –6% LifeNon-life Growth rate 2015 Pre-crisis average growth 2003–200 Post-crisis average growth 200–2014 32 Swiss Re sigma No 3/2016
2ƒ The ‚iddle East‰ —entral sia‰ Turey“ growth improves in lie‰ nonŽlie Life insurance ”ie premiums growth accelerated to ”ie insurance premium growth in the ‚iddle East‰ —entral sia and Turey ƒ…6ˆ in the ‚iddle East‰ —entral sia and accelerated to ƒ…6ˆ in 201 rom 3…2ˆ in 201’… n Turey premiums increased by Turey in 201… 6…ˆ… n the ‹ E‰ the region’s biggest maret‰ premiums grew by an estimated ¡…3ˆ‰ driven by demand rom the expatriate population and a growing middle class… n „audi rabia‰ premiums continued to grow or a second year ater ive years o decline‰ due to a shit in the investment patterns rom insurance saving products to the e«uity maret… ¢man registered robust growth in 201‰ mostly rom group lie business… n ¦ahrain‰ premiums declined slightly in 201 due to ¥amily Taaul business… n –a§ahstan‰ lie premiums rebounded by ¡…¡ˆ in 201‰ due to a strong growth in annuities‰ and despite a slowing o the oilŽbased economy… rowth was a 2 solid 12ˆ in §erbaiŠan ‰ slower than in previous years‰ resisting the decline in the overall economy… ”ie insurance penetration rates and premium volumes in the two —entral sian economies‰ however‰ are low… The outloo is positive given low The outloo or lie insurance is solid‰ but in the short term low oil prices are liely to penetration‰ rising ris awareness and weigh on growth… ”ow penetration rates and increasing awareness coupled with avourable demographics… social actors lie a move to smaller amilies and rapid growth o private sector employment‰ will drive demand in the longer term… high share o young consumers should boost demand or savings‰ protection and retirement products… The ‹ E insurance authority’s proposal to establish a maŠor nationwide lie insurance company as part o developing the lie insurance sector – while also enhancing the perormance‰ growth and competitiveness o national insurers – will urther boost sector growth… ncreasing acceptance o shariaŽcompliant products will also lend support… Non-life insurance n 201‰ nonŽlie premiums expanded by NonŽlie insurance premiums in the ‚iddle East‰ —entral sia and Turey grew by ¡…ƒˆ‰ driven by a strong acceleration in ¡…ƒˆ in 201 †201’“ £ƒ…2ˆ‡… n Turey‰ premiums were up 12ˆ ater stagnating in Turey… 201’‰ boosted by motor‰ aviation‰ credit ™ surety‰ liability and agriculture… n „audi rabia‰ strong nonŽlie premium growth continued at 20ˆ †201’“ 1ˆ‡… ˜ising rates ‘iddle ast• Œentral ’sia• and Tur„e€ in motor supported growth‰ and liewise in medical insurance… NonŽlie premium ‡reius• 2015 growth in ran is estimated to have slowed to ’…1ˆ in 201‰ but motor and accident Œorld were growing more strongly… n –a§ahstan‰ premiums grew by 3…2ˆ ater a ¡…6ˆ ‹„ bn maret share decline in 201’‰ driven by doubleŽdigit growth in most lines o business‰ particularly ”ie 6 0…2ˆ property and ‚T€”… n §erbaiŠan‰ premiums continued to decline‰ down 3ˆ NonŽlie ’3 2…1ˆ †201’“ –6…ˆ‡ as an increase in liability †£1ƒˆ‡ and ‚T€” † £’ˆ‡ were more than oset by contraction in property †–ˆ‡ and motor ownŽdamage †–2ˆ‡‰ relecting 18% Real premium growth how people are cutting bac on voluntary insurance in challenging economic times… 16% The shortŽterm outloo or the nonŽlie sector is cautiously optimistic… ‘owever‰ in the 14% environment o low energy prices‰ public spending and subsidies are being reviewed 12% or cuts and insurance demand will liely slow in the shortŽterm… ‘ealth insurance‰ however‰ is expected to expand robustly as governments enact laws re«uiring 10% compulsory health cover or all nationals and expatriates… The irst two phases o the 8% new ‘ealth nsurance ”aw in ubai have been completed and the third and last phase is expected to be inalised by •une 2016… —ompetition is liely to remain 6% intense‰ applying pressure on rates and reducing proitability o insurers… This may 4% trigger a picŽup in merger and ac«uisition activity… The recent incidence o cyber 2% breaches in the ul —ooperation —ouncil region and concerns over potential attacs have made cyber insurance a hot topic and growth area… irectors ™ ¢icers †™¢‡ 0% cover is another current theme ollowing a string o highŽproile incidents… LifeNon-life Growth rate 2015 Pre-crisis average growth 2003–200 Post-crisis average growth 200–2014 27 The igures in this section exclude srael‰ which alls under advanced countries… 28 §erbaiŠan is not among the largest marets to be shown in the appendix‰ but data can be ound on www…sigmaŽexplorer…com Swiss Re sigma No 3/2016 33
erging ar„ets continue to gain gloƒal s‚are rica“ weaer premium growth as ey economies struggle Life insurance The lie sector in rica slowed in 201‰ ”ie insurance premium growth in rica slowed to 2…ˆ in 201 rom …1ˆ in 201’… as growth cooled in many marets… n „outh rica †6ˆ regional maret share‡‰ growth slowed to an estimated 2…3ˆ rom ’…6ˆ in 201’ due to lower single and recurring premiums as household incomes were impacted by the weaening economy… n the rest o rica‰ growth was mixed‰ based on estimates and preliminary data or eight countries… €remiums in ‚orocco‰ the second largest maret‰ continued to grow‰ up by 11ˆ ater an …ˆŽ increase in 201’… The improvement was driven by individual savings business‰ while group business stagnated… €remiums also increased in Egypt †£…2ˆ‡‰ though less so than in 201’ †£6…¡ˆ‡… ‚eanwhile lgeria registered strong doubleŽdigit growth †£1ˆ‡‰ though this is still a very small maret… n „ubŽ„aharan rica †„„ ‡‰ premium growth was mostly positive… rowth in –enya cooled to a still solid …0ˆ… The severe economic slowdown in oilŽexporting Nigeria led to a contraction in lie premiums… n 2¡ ¹imbabwe ‰ lie premiums are estimated to have expanded by more than 20ˆ driven by uneral products‰ while the Namibian maret also grew solidly †£…1ˆ‡… ¥or other „„ marets‰ the latest data available are or 201’ only… The numbers suggest that premiums grew by a modest …2ˆ in „„ †excluding „outh rica‡ in 201’… ”ow lie insurance penetration and n „outh rica‰ the nearŽterm outloo or lie industry is challenging given sluggish mobile distribution technology provide economic growth‰ but that should improve in the medium term as the economy pics ample opportunity or growth in the up… „outh rican lie insurers are increasing their eorts to maret towards the lower medium to long term… income segment o society‰ which will support growth and broaden the reach o lie insurance… €remium growth is liely to be slow in the oilŽexporting countries in 2016 and 201ƒ‰ as lower economic growth and weaer currencies reduce disposable income… ‘owever‰ as lie insurance penetration is still very low‰ there is ample potential or growth… ”everaging mobile distribution technologies will be ey in selling lie insurance to the large share o the population living on low incomes… Non-life insurance NonŽlie premium growth in rica NonŽlie premium growth in rica was subdued at 1…3ˆ in 201 †201’“ 1…2ˆ‡… slowed on a broad basis in 201… espite a urther weaening economic environment‰ nonŽlie premium growth in „outh rica increased to 2…ˆ †201’“ 0…3ˆ‡… nsurers have been able to increase rates and push past adverse claims experience on to consumers‰ and underwriting ’frica ‡reius• 2015 results have improved… „olvency and sset ‚anagement †„ ‚‡‰ the risŽbased Œorld capital regulation in „outh rica‰ has been urther delayed to 201ƒ… Elsewhere in ‹„ bn maret share rica‰ nonŽlie premium growth mostly slowed… n ‚orocco‰ premium growth ”ie ’’ 1…ƒˆ weaened as commercial lines slowed‰ while motor and property beneitted rom NonŽlie 20 1…0ˆ rising rates… n –enya‰ commercial lines contributed to slower growth o …2ˆ †201’“ ¡…ˆ‡‰ but motor and medical also grew more slowly‰ while domestic ire improved… 12 Real premium growth n Egypt‰ premiums continued to contract †–1…ˆ‡… €reliminary data or Nigeria suggest that premium volumes contracted strongly †–11ˆ‡ relecting the wea 10 economic environment because o low oil prices and the uncertainty beore and ater the presidential election in ‚ay 201… n „outh rica‰ a very wea economic environment and rising inlation will be ey challenges… Exchange rate depreciation is also driving claims costs †ie‰ in motor‰ 2 where most spare parts are being imported‡… „low economic activity in maŠor oilŽ 0 exporting countries is expected to reduce premium growth… ‘owever‰ due to low Life Life, excl Non-life penetration levels‰ there are still growth opportunities such as in agriculture lines‰ South Africa inrastructure investments and in products tailored to the stillŽunderserved lower income segment o society… mong oilŽimporting countries‰ a solid economic growth Growth rate 2015 outloo should also support premium growth… Pre-crisis average growth 2003–200 Post-crisis average growth 200–201 29 ¹imbabwe is not among the largest marets to be shown in the appendix‰ but data can be ound on www…sigmaŽexplorer…com 3’ Swiss Re sigma No 3/2016
‚ethodology and data This study loos at insurance premium This sigma study is based on the direct premium volumes o insurance companies‰ volumes data rom 1’ƒ countries… regardless o whether private or stateŽowned… €remiums paid to state social insurers are not included… ”ie and nonŽlie premium volume in 1’ƒ countries is examined… etailed inormation on the largest countries in terms o total insurance premium volume can be ound in the statistical appendix… Œhere not indicated‰ igures and chart inormation in this report are all sourced rom „wiss ˜e Economic ˜esearch ™ —onsulting… ll «uoted growth rates are in real terms ll premium growth rates «uoted in the text are in real terms‰ ie‰ adŠusted or inlation †measured using local consumer price indices‡‰ unless otherwise noted… —ountry classiications generally ollow The designation o the economies in this sigma as “advanced” or “emerging” is ‚¥ conventions… generally in eeping with the conventions o the nternational ‚onetary ¥und †‚¥‡… dvanced economies include the ‹„‰ —anada‰ Œestern Europe †excluding Turey‡‰ srael‰ ¢ceania‰ •apan and the other advanced sian economies †‘ong –ong‰ „ingapore‰ „outh –orea and Taiwan‡… ll other countries are classiied as “emerging” and generally correspond to the ‚¥’s “emerging and developing” economies…30 ata sources… The insurance data and estimates contained in the study originate primarily rom national supervisory authorities and‰ in some cases‰ rom insurance associations… ‚acroeconomic data was sourced rom the nternational ¥inancial „tatistics o the ‚¥‰ ¢xord Economics and ‘„ lobal nsights… ata revisions ¥igures or past years are adŠusted as new inormation becomes available‰ while the 31 sigma world insurance tables are updated and published at the beginning o each calendar year… „ince the publication o last years’ sigma‰ global premium volume or 201’ is unchanged or lie insurance and has been revised by Ž1…1ˆ or nonŽlie… einition o premium income This report is based on inormation concerning the premiums written or direct business by all registered insurers… This means“ 1… irect insurance premiums‰ including commissions and other charges‰ are considered prior to cession to a reinsurance company… 2… omestic insurers – regardless o their ownership – and domestic branches o oreign insurers are regarded as domestically domiciled business units… ¦usiness undertaen by the oreign branches o domestic insurers is not regarded as domestic business… 3… ¦usiness that has been written in the domestic maret includes premiums or cover o domestic riss as well as those covering oreign riss‰ as long as they are written by domestic insurers †crossŽborder business‡… ‘ealth insurance is allocated to nonŽlie ”ie and nonŽlie business areas in this sigma study are categorised according to business… standard E‹ and ¢E— conventions“ health insurance is allocated to nonŽlie insurance‰ even i it is classiied dierently in individual countries… ensity and penetration do not include ¢nly premium income rom domestic riss is used to calculate insurance penetration crossŽborder business… and density… —rossŽborder business is not included… This has a signiicant eect in ”uxembourg‰ taly and reland… rowth rates in local currency are ‹nless otherwise stated‰ premium growth rates indicate changes in real terms… adŠusted or inlation… These real growth rates are calculated using premiums in local currencies and adŠusted or inlation using the consumer price index or each country… The statistical appendix also provides the nominal change in growth or each country… ˜egional aggregated growth rates are calculated using the previous year’s premium volumes and converted into ‹„ dollars at maret exchange rates… The same procedure applies to the economic aggregates o Table ®‰ where the previous year’s nominal € igures in ‹„ dollars are used as weights… 30 The only exceptions are the —§ech ˜epublic‰ Estonia‰ „lovenia and „lovaia… 31 The update o the tables can be ound on www…swissre…com/sigma… Swiss Re sigma No 3/2016 3
‘et‚odolog€ and data ¥igures are converted into ‹„ dollars to ‹sing the average exchange rate or the inancial year‰ premium volumes are acilitate international comparisons… converted into ‹„ dollars to acilitate comparisons between marets and regions…32 Œhere no premium data is available †indicated by “na…” or the local currency value in the tables‡‰ the premium income in ‹„ dollars is estimated assuming a constant ratio o insurance premiums to €… ˜egional growth rates are calculated using a weighted average o the real growth rates o the individual countries… The weighting is based on the relevant premiums o the previous year in ‹„ dollars… „tatistical appendix… The statistical appendix contains additional calculations and the macroeconomic data used or currency conversions… cnowledgements… The sigma editorial team would lie to than the supervisory authorities‰ associations and companies that helped with data compilation… 32 n Egypt‰ ndia‰ ran‰ •apan‰ „outh –orea and ‚alaysia‰ the inancial year is not the same as the calendar year… €recise details about the dierences in dates are given in the notes to the statistical appendix… 36 Swiss Re sigma No 3/2016
„tatistical appendix 1 Excluding crossŽborder business 2 E xcludes advanced countries in „outh and East sia †‘ong –ong‰ „ingapore‰ „outh –orea‰ Taiwan‡ 3 nsurance penetration †premiums as a percentage o €‡ and density †premiums per capita‡ include crossŽborder business ’ N orth merica‰ Œestern Europe †excluding Turey‡‰ •apan‰ ‘ong –ong‰ „ingapore‰ „outh –orea‰ Taiwan †counted as an emerging maret in earlier editions‡‰ ¢ceania‰ srael ” atin merica‰ —entral and Eastern Europe‰ „outh and East sia‰ the ‚iddle East †excluding srael‡ and —entral sia‰ Turey‰ rica 6 3 ’ member countries ƒ T he ‹„‰ —anada‰ the ‹–‰ ermany‰ ¥rance‰ taly‰ •apan T he ‹„‰ —anada‰ ‚exico ¡ „ ingapore‰ ‚alaysia‰ Thailand‰ ndonesia‰ the €hilippines‰ ¨ietnam… The our remaining member countries – ¦runei‰ —ambodia‰ ”aos and ‚yanmar – are not included… 10 ” ie insurance“ premiums are supplemented by estimated premiums or group pension business‰ which has not been included in the statistics or some regions since 2001… NonŽlie insurance includes state unds… 11 ”ie insurance“ net premiums 12 NonŽlie insurance“ gross premiums‰ including reinsurance premiums 13 ¥inancial year 1 pril 201–31 ‚arch 2016 1’ ¥ inancial year 21 ‚arch 201–20 ‚arch 2016 1 ¥ inancial year 1 •uly 201’–30 •une 201 16 ¥ inancial year 1 •uly 201’–30 •une 201… ustralia“ until 2012‰ supervisory data included premiums written by public insurers… ‘owever‰ this is not available in 2013 thus contributing to the signiicant decline in annual comparison… 1ƒ nlationŽadŠusted premium growth rates in local currency‰ see Tables ‰ ¨ and ¨ 1 ncluding the remaining countries 1¡ E ective nlation used or calculating real growth rates are estimated by the nstitute or nternational ¥inance… These are twice the oicial igures… 20 „upervisory authority data or 2013 does no longer report premiums written by public insurers… ˜etrospectively starting 2003‰ public insurer data has been removed rom the sigma data set and the data has been changed to calendar year data… €rior 2003 inancial year is rom 1 •uly–30 •une‰ ie 2002 stands or data rom 1 •uly 2002–30 •une 2003 £ provisional ¿ estimated ¿¿ estimated ‹„ value assuming constant insurance penetration Swiss Re sigma No 3/2016 3ƒ
Table †reiu olue ƒ€ region and organisation in 2015 1 1 †reiu olue Œ‚ange —in ˜ S‚are of world †reius †reius ‡er —in illions of ™S“˜ inflation-ad”usted ar„et —in ˜ in of Ž“† ca‡ita —in ™S“˜ Total ƒusiness 2015 2014 2015 2014 2015 2015 2015 ’erica 1 5‹ 5 1 5ˆ 0ˆ . 0.ˆ 4.‹0 .42 1 10.0 North merica 1 ’31 23¡ 1 3¡ƒ ƒ1 3… 0…1 31…’3 ƒ…2¡ ’ 006…¡ ”atin merica and —aribbean 1 1’6 1ƒ 323 ’…6 …2 3…’ƒ 3…0¡ 21…0 uro‡e 1 4 ˆ 1 ‹5 0‹1 1.2 .4 2.2 .‹ 1 4.4 Œestern Europe 1 ’1 1 1 62’ 12 1…’ 3…6 31…0 ƒ…ƒ2 2 0…’ —entral and Eastern Europe 3 6¡3 ƒ0 2ƒ¡ –’… –1…3 1…1 1…¡2 16…6 ’sia 1 50 ‹ˆ4 1 1 ˆ4 .2 .1 2‹.ˆ 5.4 11.ˆ dvanced sian marets ƒƒ3 0¡ ƒ¡¡ 3 ’…2 3…3 16…¡ 11…¡ 3 ¡… Emerging sia 2 2’ 211 ’62 6ƒ 1…2 11…1 11…1 3…33 1’0…0 ‚iddle East and —entral sia 3 ƒ0’ 1 6ƒ …¡ ¡…3 1…1 1… 12…0 ’frica 4 12 ˆ0 11 2.4 .‹ 1.41 2.‹0 54.ˆ –ceania 0 42 ‹‹ 55ˆ –4.5 15.1 1.ˆˆ 5.5 2 05.0 World 4 55 ˆ5 4 ˆ54 ˆ10 . .5 100.00 .2 21.2 dvanced marets ’ 3 ƒ0’ 063 3 ¡26 ’02 2… 2…6 1…3’ …12 3 ’3¡…6 Emerging marets ’¡ ƒ23 2 30 ¡… ƒ…6 1…66 2…¡2 13…0 Emerging marets excl —hina ’63 222 ’¡¡ 6¡ ’…2 3…3 10…1ƒ 2…3 ¡’…1 ¢E— 6 3 602 1¡0 3 3ƒ ƒ 2…’ 2…’ ƒ¡…10 ƒ…60 2 ƒ1ƒ…ƒ ƒ ƒ 2 0¡ ¡6ƒ 2 ¡31 2ƒ 2…ƒ 1… 61…ƒ1 …0 3 63ƒ…1 Euro§one ¡’0 61¡ 1 113 61 1…0 …ƒ 20…66 ƒ…’1 2 22… E‹ 1 32 16 1 ¡ 61 1…’ 3…6 2¡…ƒ0 ƒ…ƒ 2 ’11…¡ E‹‰ 1 countries 1 31’ ¡2 1 1’ ¡ƒ 1…’ 3… 2… …01 2 ¡1…0 N ¥T 1 ’6 ’6’ 1 ’2 266 3… 0…1 31…¡ ƒ…01 3 006…ƒ „E N ¡ ƒ ¡21 3’ …1 6… 1…¡3 3…3 12…2 Life ƒusiness ’erica 0ˆ 0 0 4.2 –0.5 2. 2.ˆ0 ˆ.ˆ North merica 601 3ƒ ¡0 3… –1…0 23…ƒ 3…06 1 6’…¡ ”atin merica and —aribbean 66 201 ƒ’ 2 ƒ… 3…1 2…61 1…2¡ 10…1 uro‡e ˆ2 115 1 002 55‹ 1.2 5.ˆ 4.42 4.1 ‹ˆ.2 Œestern Europe 6 62’ ¡2 ¡3 1…3 … 33…1 ’…ƒ6 1 ¡2…2 —entral and Eastern Europe 1 ’¡1 1¡ 621 –3… –2…0 0…61 0…6 ’…0 ’sia ‹04 5‹ 42 ˆ. 5.1 5.ˆ0 .5‹ 20‹. dvanced sian marets ƒ¡ 1ƒ’ ¡ƒ ¡’0 ’…2 3…3 22…6 …ƒ6 2 ƒ13…3 Emerging sia 2 312 3’3 2ƒ 2ƒ0 1…6 ¡…1 12…33 1…¡¡ 3…’ ‚iddle East and —entral sia 13 02 13 23 …0 10… 0…2 0…’6 36…¡ ’frica 4 ˆ04 4ˆ 05 2. 5.1 1.ˆ2 1.‹ˆ ˆ. –ceania 45 ‹ 5 15‹ –ˆ. 2ˆ.5 1.ˆ‹ .15 1 15.5 World 2 5 1 2 55 5‹ 4.0 4. 100.00 .4ˆ 45.ˆ dvanced marets ’ 2 0¡ ƒ6 2 232 1¡3 2… 3… 2…’ƒ ’…61 1 ¡3…ƒ Emerging marets ’’’ 02 ’23 3¡¡ 11…ƒ 6… 1ƒ…3 1…2 ƒ0…6 Emerging marets excl —hina 233 2¡0 2’6 ’0 …¡ 2…6 ¡…21 1…2ƒ ’ƒ…’ ¢E— 6 1 ¡ƒ¡ ¡2 2 130 ¡20 2…2 3… ƒ…1’ ’…1¡ 1 00…0 ƒ ƒ 1 31 61 1 61’ 6¡ƒ 2…ƒ 2…1 60…’6 ’…’6 2 01’… Euro§one 0 60¡ 63 ¡1 0… ¡…ƒ 21…ƒ3 ’…2 1 ’’6…2 E‹ 20 26 ¡’’ 3ƒ 1…3 …¡ 32…3ƒ ’…6 1 ’¡2…1 E‹‰ 1 countries 0 6ƒ2 ¡26 66¡ 1…’ 6…1 31…0 …00 1 ’’… N ¥T 613 2¡¡ ¡ 6 3… –0…¡ 2’…20 2…¡ 1 266…1 „E N ¡ ƒ 1ƒ2 ƒ 26¡ …’ …ƒ 2…26 2…36 ¡0…3 Non-life ƒusiness ’erica ‹21 4ˆ ‹15 2 .1 1. 45.1 .ˆ2 ‹. North merica 2¡ ’02 11 ƒƒ1 3…2 0…¡ ’1…06 ’…22 2 322…0 ”atin merica and —aribbean ¡1 ¡’ 103 ’¡ 2…3 6…¡ ’… 1…0 1’…¡ uro‡e 5‹ ˆ ‹2 5 1.1 0. 2‹.54 2.ˆ 4ˆ.2 Œestern Europe 61 6’1 ƒ’ 1… 0…’ 2ƒ…6 2…¡6 ¡…3 —entral and Eastern Europe 3 202 0 6 –’…¡ –1…0 1…¡ 1…36 11ƒ…6 ’sia 44 405 42ˆ 411 ‹.2 . 22.10 1.ˆ4 102.0 dvanced sian marets 1¡3 201 ¡ ’…1 3…’ ¡…60 2…3 ƒ6… Emerging sia 2 211 6 1ƒ 3 1’…6 1’…2 10…’¡ 1…3 6…6 ‚iddle East and —entral sia ’0 62 3 ’26 ¡…0 …ƒ 2…01 1…’2 11…1 ’frica 20 41‹ 22 511 1. 1.2 1.01 0.‹2 1ˆ.4 –ceania 5 0 41 ‹ 0.1 1.1 1.ˆ 2.4 ‹‹.5 World 2 01‹ ‹ˆ 2 0‹‹ 11 . 2.4 100.00 2.ˆˆ 2ˆ5. dvanced marets ’ 1 61’ 2¡ 1 6¡’ 20¡ 2…6 1…1 ƒ¡…¡2 3…1 1 ’…¡ Emerging marets ’0 6ƒ0 ’0’ ¡0¡ ƒ… …6 20…0 1…3¡ 6’…’ Emerging marets excl —hina 22¡ ¡33 23 ’1¡ 2… ’…1 11…3 1…2 ’6…ƒ ¢E— 6 1 622 26 1 ƒ06 63ƒ 2…6 1…0 0…31 3…’0 1 21ƒ… ƒ ƒ 1 2ƒ 10 1 316 31 2…6 0… 63…2ƒ 3…¡ 1 622…6 Euro§one 3¡0 00¡ ’¡ ¡10 1…3 0… 1¡…31 3…16 1 0ƒ6…6 E‹ 32 230 61’ ƒ0 1… 0…’ 26…3 2…¡ ¡1¡… E‹‰ 1 countries 0¡ 23 2 1…’ 0…’ 2…21 3…00 1 106… N ¥T ’3 16 26 ƒ 3…3 0…¡ ’1…ƒ’ ’…06 1 ƒ’0…6 „E N ¡ 30 ƒ’¡ 31 0 ƒ…6 3… 1…2 0…¡¡ 3ƒ…¡ 3 Swiss Re sigma No 3/2016
Table Total ‡reiu olue in local currenc€ in 2015 †reiu olue Œ‚ange —in ˜ Œ‚ange —in ˜ —in illions of local currenc€˜ noinal inflation-ad”usted Œountr€ Œurrenc€ 2015 2014 201 2015 2014 2015 2014 Nort‚ ’erica ‹nited „tates 10 ‹„ 1 316 2ƒ1 1 2ƒ0 ƒ0 1 2’ ƒƒ6 3…6 1…3 3… –0…3 —anada 11 — 1’ƒ 020 ¿ 1’0 30 131 2¡ ’… 6… 3…6 ’… Total .5 0.1 Latin ’erica and Œariƒƒean ¦ra§il ¦˜” 230 10 ¿ 206 663 1ƒ¡ 102 11…’ 1…’ 2…2 … ‚exico ‚®N ’00 3’’ £ 366 30ƒ £ 3’¡ 03 ¡…3 ’…¡ 6…’ 0…¡ rgentina 1¡ ˜„ 1ƒ¡ ¡11 12 ƒ’’ ¡2 ƒ6ƒ 3¡…ƒ 3… ¡… 1…0 —hile —”€ ƒ ’0 3’2 6 223 20 ƒ¡¡ ¡ 1¡…0 ƒ…3 1…2 3… —olombia —¢€ 21 0ƒ 230 1¡ 036 1ƒ0 1 33 ’20 13…0 1…1 ƒ…6 –1… ¨ene§uela ¨E¦ 323 3 ¿ 1’2 33 ƒ’ 12ƒ…3 66…3 –1… 2…6 €eru €EN 11 ƒ’’ 10 1’ ¡ 06¡ 1…ƒ 12…0 11…ƒ … Ecuador ‹„ 2 232 2 2 2 0’ –1…0 …2 –’…¡ ’… €anama € ¦ na… 1 3’3 1 2’’ na… ƒ…¡ na… …2 ‹ruguay ‹µ‹ 3’ ’ƒ 30 2 2’ ƒ’¡ 13… 22…’ ’… 12…’ Trinidad and Tobago TT ƒ 32 ¿ 6 31 ¡6 12…2 ¡… 6…3 3…6 —osta ˜ica —˜— 6’ 060 622 ¡2 1ƒ ¡0 –¡…’ 20…2 –10…3 1…0 ominican ˜epublic ¢€ 36 ’1 ¿ 33 1ƒ 31 0’1 ƒ…¡ …¡ ƒ…0 … uatemala T· ¡66 63¡ 21¡ … …1 3…’ ’… —ayman slands –µ na… ¡6 0’ na… 1…’ na… 16… Total 4. 5.2 uro‡e ‹nited –ingdom ¦€ 20¡ ’ƒ1 ¿ 20 013 20 202 2…2 –1… 2…1 –3…0 ¥rance E‹˜ 20ƒ ƒƒ6 £ 202 62 1¡2 1’’ 2…’ …6 2…’ …0 ermany E‹˜ 1¡2 201 £ 1¡1 ¡62 1ƒ 0¡ƒ 0…1 2…6 –0…1 1…ƒ taly E‹˜ 1’ ƒ3 ¿ 1’6 26 12ƒ 1’ƒ 1… 1…2 1… 1…0 Netherlands E‹˜ ƒ2 636 ¿ ƒ3 231 ƒ’ ƒƒ –0… –2…2 –1…’ –3…1 „pain E‹˜ 2¡ ¿ 3 ƒ6¡ ’ 1¡¡ 2… –0… 3…3 –0…6 „wit§erland —‘¥ ¡6¡ £ ’ ¡ 0…2 0…0 1…’ 0…0 reland E‹˜ ’¡ ƒ26 ¿ ’ ƒƒ ¿ 3 201 ¿ …ƒ 1¡… …ƒ 1¡…’ „weden „E– 22 ƒ’ £ 26 ƒ¡ 2’ƒ ¡¡ 6…3 ƒ…2 6…3 ƒ…’ ¦elgium E‹˜ 2¡ 11 ¿ 30 3 2 1ƒ –2…’ ƒ…1 –2…¡ 6…ƒ enmar –– 20’ ’00 ¿ 200 ¡2 1¡ 100 1…ƒ 6…3 1…3 …ƒ ¥inland E‹˜ 2’ 6 ¿ 23 06 21 ¡ 6…’ …1 6…ƒ ’…0 ”uxembourg E‹˜ 2’ 1 £ 26 ’22 22 ’ƒ –…6 1ƒ… –…6 16…ƒ Norway N¢– 160 20ƒ ¿ 1ƒ 1ƒ 1’’ 2’6 1… ¡…’ –0…6 ƒ…2 ustria E‹˜ 1ƒ ’6 1ƒ 1’3 16 ¡¡ 2…0 3…3 1…1 1…6 ˜ussia ˜‹¦ 1 023 1¡ ¡ƒ ƒƒ3 ¡0’ 6’ 3…6 ¡…2 –10…3 1…2 €ortugal E‹˜ 12 ’ ¿ 1’ ’10 ¿ 13 22 ¿ –10… ¡…0 –11…2 ¡…3 €oland €”N 3 31 £ ’ 3ƒ ƒ 1ƒ0 –1…¡ –’…¡ –0…¡ –…1 Turey T˜µ 30 26 2 3ƒ 23 ƒ02 1¡…’ ƒ…0 10…¡ –1…ƒ —§ech ˜epublic —¹– 13 3¡ £ 1ƒ ¡1 16 2’ –2…¡ 0…¡ –3…2 0… reece E‹˜ 3 ƒ3’ £ 3 ¡ƒ0 ’ 012 –…¡ –1…1 –’…3 0…2 ”iechtenstein —‘¥ 3 22 3 ’10 3 30 –3… 0…¡ –2…6 0…¡ ‚alta E‹˜ na… 2 1 2 ƒ na… ¡…’ na… …6 ‘ungary ‘‹¥ 32 623 £ 1 2’ƒ ƒƒ¡ 2ƒƒ 2…1 ’…6 2…2 ’… „lovaia E‹˜ 1 ¡1 2 0ƒƒ 2 06’ –’…ƒ 0…ƒ –’…3 0…ƒ „lovenia E‹˜ 1 ¡ƒ 1 ¡3 1 ¡ƒ 2…0 –2…0 2… –2…2 ˜omania ˜¢N ¡ £ 06 122 …¡ –0… 6… –1… ‹raine ‹ ‘ 2¡ ƒ36 26 ƒ6ƒ 2 662 11…1 –6…6 –2’…¡ –16… —roatia ‘˜– ƒ0¡ £ 61 ¡ 0ƒƒ 1…ƒ –…ƒ 2…2 –… ¦ulgaria ¦N 1 6 £ 1 ƒ32 1 663 …¡ ’…1 ¡…0 …6 —yprus E‹˜ ƒ26 £ ƒ22 ƒ62 0…6 –…3 2…2 –…1 „erbia ˜„ 1 ’2 £ 6¡ ’0 6’ 0’2 1ƒ…¡ …’ 16…0 6…2 Total 1.2 .4 ’sia •apan 13 •€µ ’ 01’ 20 ¿ 2 3¡’ ƒ0 ’¡ ¡30 ƒ¡0 3…1 ’…¡ 2…¡ 1…¡ €˜ —hina —Nµ 2 ’2 22 £ 2 023 ’2 1 ƒ22 22’ 20…0 1ƒ… 1…3 1…2 „outh –orea 13 –˜Œ 1ƒƒ ¡63 ’00 16 0 00 1¡ 1’6 00 …6 …¡ ’… ’…ƒ Taiwan TŒ 3 062 ƒ¡6 2 ¡03 30 2 ƒ0 ’36 … ƒ…2 … …¡ ndia 13 N˜ ’ 6¡ 10 ¿ ’ 12 26 3 ¡’2 1ƒ’ 13…1 …3 ƒ…¡ –1…2 ‘ong –ong ‘– 3’ 61 £ 31 00 2 6’2 11… 10…2 …2 … „ingapore „ 3 01 ¿ 3’ 31 2ƒ 10… 11… 11…0 10…3 Thailand T‘¦ ƒ’2 6’ ƒ0’ ƒ’3 6’’ ’’¡ …’ ¡…’ 6…3 ƒ…3 srael ”„ na… ’63 ’ 0’0 na… …2 na… ƒ…ƒ ndonesia ˜ 1¡¡ ¡66 ¡00 1ƒ3 632 ’00 13 ¡3’ 00 1…2 12… …3 6…0 ‚alaysia 13 ‚µ˜ ’2 ƒƒ 2 0’ƒ ’…ƒ ƒ…2 1…ƒ ’…6 ‹nited rab Emirates 12 E 3ƒ 066 ¿ 32 ƒ1 2¡ 20ƒ 13…2 12…1 …ƒ ¡…6 „audi rabia „ ˜ 3ƒ 0¡0 ¿ 30 ’2 2 2’0 21…ƒ 20… 1¡…1 1ƒ…6 ran 1’ ˜˜ 23¡ ¡1 00 ¿ 20 3¡¡ 00 162 0 00 16… 26…ƒ ’…1 ¡…ƒ €hilippines €‘€ 22 31 21’ ƒ2 21 ƒ6¡ 1ƒ…6 –0… 16…0 –’… ¨ietnam ¨N 6 6’¡ ’00 660 ’0 ’ƒ ƒƒƒ 0ƒ0 1ƒ…¡ 16… 16…¡ 11…3 ·atar · ˜ 10 313 ¿ ¡ ƒ’6 ¿ ƒ 260 ¿ … 3’…2 ’…1 2¡…¡ €aistan €–˜ 22’ 23 ¿ 1¡¡ ’00 ¿ 1ƒ6 000 ¿ 12… 13…3 ¡…ƒ …ƒ ”ebanon ”¦€ 2 2¡2 ’6 ¿ 2 223 ’’ 2 13’ 61 3…1 ’…2 ƒ…1 3…0 ¦angladesh ¦T na… 101 ¡¡’ ¿ ¡3 ’1ƒ ¿ na… ¡…2 na… 2…0 ‚acao ‚¢€ na… ƒ’ƒ 6 2’ na… 2…2 na… 20…¡ –a§ahstan –¹T 263 30 236 ’11 23 0ƒ3 11…’ –6…6 ’… –12…’ ¢man ¢‚˜ ’32 ¿ 3¡ 36’ …6 ¡…3 …6 …2 –uwait –Œ 31 ¿ 302 £ 2ƒƒ ’… …ƒ 1…2 …6 „ri ”ana ”–˜ na… na… na… na… na… na… na… •ordan •¢ 2 ¿ 26 ’¡1 …1 ƒ…1 …¡ ’…1 ¦ahrain ¦‘ 21 ¿ 2ƒ1 2 3…6 ’… 1…ƒ 2…1 Total .2 .1 ’frica „outh rica ¹ ˜ 6 3’1 ¿ ’ƒ ƒ¡’ ’¡ƒ 61 ƒ…0 10…1 2…3 3… ‚orocco ‚ 30 ’23 £ 2 ’22 26 ƒ3’ ƒ…0 6…3 …3 … Egypt 1 E€ 1 ’3 £ 13 ƒ60 12 233 12… 12… 1…3 2…2 –enya –E„ 1ƒ6 30 ¿ 1 ƒ 12¡ 1¡0 13…2 20…6 6…2 12… Nigeria NN 20 16 ¿ 2’ 203 2ƒ6 2¡ –1…2 2… –¡…’ –’…¡ lgeria ¹ 126 ’1 ¿ 11 ¡ 110 ƒ1 6…3 ƒ…’ 1… ’…3 Namibia N 11 6¡3 ¿ 10 ƒƒ2 ¡ 1ƒ6 …6 1ƒ…’ ’… 11…’ ngola –¹˜ na… na… ¡ƒ 606 na… na… na… na… Tunisia TN na… 1 ’0 1 3¡ na… 10…2 na… …0 ‚auritius ‚‹˜ na… 2’ 16 22 0ƒ na… 12… na… ¡…0 Total 2.4 .‹ –ceania ustralia 20 ‹ ¡3 ¡¡ ¡ƒ ’6 1 202 –3…6 20…0 –…0 1ƒ…1 New ¹ealand 16 N¹ 13 1 ¿ 13 62ƒ 13 3ƒ¡ –0…3 1…¡ –0…ƒ 0…¡ Total –4.5 15.1 World World . .5 Swiss Re sigma No 3/2016 3¡
Table Total ‡reiu olue in ™S“ in 2015 †reiu olue —in illions of ™S“˜ Œ‚ange —in ˜ 2015 S‚are of world Ran„ing Œountr€ 2015 2014 noinal —in ™S“˜ 1ˆ inflation-ad”usted ar„et 2015 —in ˜ Nort‚ ’erica 1 ‹nited „tates 10 1 316 2ƒ1 ¿¿ 1 2ƒ0 ƒ0 3…6 3… 2…¡0 ¡ —anada 11 11’ ¡6 ¿ 12ƒ 0’2 –¡… 3…6 2…2 Total 1 41 2‹ 1 ‹ˆ ˆ51 2.4 .5 1.4 Latin ’erica and 1’ ¦ra§il 6¡ 0¡1 ¿ ƒ 11 –21…3 2…2 1…2 Œariƒƒean 26 ‚exico 2 22 £ 2ƒ 16 £ –…3 6…’ 0… 2¡ rgentina 1¡ 1¡ ’10 1 ’ 22… ¡… 0…’3 3ƒ —hile 11 326 10 ¡11 3… 1…2 0…2 ’3 —olombia ƒ ’’ ¡ 10 –1ƒ… ƒ…6 0…1ƒ ’’ ¨ene§uela ƒ 00 ¿ ¡ 31¡ –1¡… –1… 0…16 ’ €eru 3 616 3 ƒƒ 1…1 11…ƒ 0…0 Ecuador 2 232 2 2 –1…0 –’…¡ 0…0 6 €anama 1 ’00 ¿¿ 1 3’3 ¿¿ ’…3 na… 0…03 6 ‹ruguay 1 26 1 303 –2…¡ ’… 0…03 ƒ2 Trinidad and Tobago 1 1’6 ¿ 1 01¡ 12… 6…3 0…03 ƒ —osta ˜ica 1 06 ¿¿ 1 1ƒ ¿¿ –…ƒ –10…3 0…02 2 ominican ˜epublic 00 ¿ ƒƒ6 3…0 ƒ…0 0…02 ’ uatemala ƒƒ ¿¿ ƒ2¡ ¿¿ 6…3 3…’ 0…02 —ayman slands ƒƒ ¿¿ ƒ16 ¿¿ … na… 0…02 ¢ther countries ’ ƒ01 ’ 3ƒ 0…10 Total 15 14 1ˆ 2 –11. 4. .4ˆ uro‡e ’ ‹nited –ingdom 320 1ƒ6 ¿ 33ƒ ƒ¡¡ –…2 2…1 ƒ…03 ¥rance 230 ’ £ 26¡ 60ƒ –1’… 2…’ …06 6 ermany 213 263 £ 2 121 –16…’ –0…1 ’…6 ƒ taly 16 03ƒ ¿ 1¡’ ƒ3 –1…3 1… 3…62 11 Netherlands 0 ¡ ¿ ¡ƒ 32 –1ƒ…2 –1…’ 1…ƒƒ 1 „pain 61 31 ¿ ƒ1 ’¡ –1’…2 3…3 1…3 16 „wit§erland 61 2¡ £ 6’ 31 –’…ƒ 1…’ 1…3 1ƒ reland 1ƒ ¿ 60 11 ¿ –¡…3 …ƒ 1…21 20 „weden 33 02 £ 3 ƒ60 –13…6 6…3 0…ƒ’ 21 ¦elgium 33 0ƒ ¿ ’0 –1… –2…¡ 0…ƒ3 22 enmar 30 33 ¿ 3 ƒƒ2 –1…1 1…3 0…6ƒ 2’ ¥inland 2ƒ 2’6 ¿ 30 6 –11…1 6…ƒ 0…60 2 ”uxembourg 26 01 £ 3 11 –23…ƒ –…6 0…¡ 2 Norway 1¡ 6’ ¿ 2 060 –20…ƒ –0…6 0…’’ 30 ustria 1¡ ’02 22 ƒ3 –1’… 1…1 0…’3 31 ˜ussia 16 01 2 ƒ3 –3’…ƒ –10…3 0…3ƒ 3 €ortugal 1’ 263 ¿ 1¡ 11 ¿ –2… –11…2 0…31 36 €oland 1’ 1’’ £ 1ƒ 236 –1ƒ…¡ –0…¡ 0…31 3 Turey 11 1’0 11 ¡ –3…¡ 10…¡ 0…2’ ’ —§ech ˜epublic 6 236 £ ƒ 60 –1…0 –3…2 0…1’ ’ƒ reece ’ 1’3 £ 2ƒ6 –21… –’…3 0…0¡ ’¡ ”iechtenstein 3 ’11 3 ƒ2ƒ –… –2…6 0…0ƒ 0 ‚alta 3 32 ¿¿ 3 ƒ’ –11…2 na… 0…0ƒ 3 ‘ungary 2 ¡1 £ 3 0 –1…0 2…2 0…0ƒ 6 „lovaia 2 1¡ 2 ƒ61 –20…’ –’…3 0…0 ƒ „lovenia 2 1¡2 2 ƒ’ –1’…¡ 2… 0…0 ¡ ˜omania 2 13ƒ £ 2 ’1’ –11… 6… 0…0 66 ‹raine 1 33¡ 2 22 –’0… –2’…¡ 0…03 6ƒ —roatia 1 2ƒ0 £ 1 ’¡ –1’…ƒ 2…2 0…03 ƒ’ ¦ulgaria 1 06¡ £ 1 1ƒ –¡…0 ¡…0 0…02 1 —yprus 06 £ ¡¡ –16…0 2…2 0…02 6 „erbia ƒ3 £ ƒ –’…1 16…0 0…02 ¢ther countries 3 001 3 1¡6 0…0ƒ Total 1 4 ˆ 1 ‹5 0‹1 –1. 1.2 2.2 ’sia 2 •apan 13 ’’¡ ƒ0ƒ ¿ ’ƒ6 1 –…6 2…¡ ¡… 3 €˜ —hina 36 00 £ 32 ’3¡ 1ƒ…ƒ 1…3 …’¡ „outh –orea 13 13 620 1 1 –3…3 ’… 3…3ƒ 10 Taiwan ¡ ¡ƒ¡ ¡ 622 0…’ … 2…11 12 ndia 13 ƒ1 ƒƒ6 ¿ 6ƒ ¡06 …ƒ ƒ…¡ 1… 1¡ ‘ong –ong ’ ƒ’ £ ’1 010 11…6 …2 1…00 23 „ingapore 2 00’ ¿ 2ƒ 11 1… 11…0 0…61 2ƒ Thailand 21 62 ¿¿ 21 6¡ ¿¿ –0…1 6…3 0…’ 32 srael 1 2¡ ¿¿ 16 3’0 –6…’ na… 0…3’ 33 ndonesia 1’ ¡30 ¿¿ 1’ 63 ¿¿ 1…¡ …3 0…33 3’ ‚alaysia 13 1’ 31 16 63 –13…ƒ 1…ƒ 0…32 3¡ ‹nited rab Emirates 12 10 0¡3 ¿ ¡1 13…2 …ƒ 0…22 ’0 „audi rabia ¡ ¡1 ¿ 12¡ 21…ƒ 1¡…1 0…22 ’2 ran 1’ ƒ ƒƒ ¿ ƒ ƒ3 1…6 ’…1 0…1ƒ ’6 €hilippines 0 ¿¿ ’ 3ƒ ¿¿ 1’…ƒ 16…0 0…12 2 ¨ietnam 2 ¡¡ƒ ¿¿ 2 62ƒ ¿¿ 1’…1 16…¡ 0…0ƒ ’ ·atar 2 33 ¿ 2 6ƒƒ ¿ … ’…1 0…06 €aistan 2 12 ¿ 1 ¡ƒ2 ¿ 10…6 ¡…ƒ 0…0 62 ”ebanon 1 21 ¿ 1 ’ƒ 3…1 ƒ…1 0…03 63 ¦angladesh 1 ’ƒ3 ¿¿ 1 31’ ¿ 12…1 na… 0…03 ƒ0 ‚acao 1 23ƒ ¿¿ 1 0¡ ¿¿ 13…0 na… 0…03 ƒ1 –a§ahstan 1 1 1 31¡ –10…0 ’… 0…03 ƒ3 ¢man 1 12’ ¿ 1 03 …6 …6 0…02 ƒ6 –uwait 1 0’ ¿ 1 060 £ –1…2 1…2 0…02 ƒ „ri ”ana ¡2 ¿¿ 62 ¿¿ 3… na… 0…02 3 •ordan ƒƒ ¿ ƒ’0 …1 …¡ 0…02 ¦ahrain ƒ’6 ¿ ƒ20 3…6 1…ƒ 0…02 ¢ther countries 1 ¡ 2 131 0…0’ Total 1 50 ‹ˆ4 1 1 ˆ4 2. .2 2‹.ˆ ’frica 1 „outh rica ’ ¡ ¿ 0 02 –¡…0 2…3 1…01 1 ‚orocco 3 122 £ 3 31 –ƒ…ƒ …3 0…0ƒ 60 Egypt 1 2 10 £ 1 ¡ƒ’ 6… 1…3 0…0 61 –enya 1 ƒ¡ƒ ¿ 1 ƒƒ2 1…’ 6…2 0…0’ 6’ Nigeria 1 ’20 ¿ 1 ƒ¡2 –20… –¡…’ 0…03 6¡ lgeria 1 262 ¿ 1 ’ƒ6 –1’… 1… 0…03 ƒƒ Namibia ¡1ƒ ¿ ¡¡ –ƒ… ’… 0…02 ƒ¡ ngola 3 ¿¿ 1 0 ¿¿ –1¡…2 na… 0…02 0 Tunisia 23 ¿¿ ¡0ƒ –¡…3 na… 0…02 ƒ ‚auritius ƒ’¡ ¿¿ 22 –… na… 0…02 ¢ther countries 11’ ’’1 0…11 Total 4 12 ˆ0 11 –.5 2.4 1.41 –ceania 13 ustralia 20 ƒ0 ƒ ƒ 22 ¿¿ –1¡…6 –…0 1… ’1 New ¹ealand 16 ¡ 3¡¡ ¿ 11 30’ –16…¡ –0…ƒ 0…21 ¢ther countries ’’1 ’30 0…01 Total 0 ’26 ¡¡ ƒ –1¡…2 –’… 1…ƒƒ World World 4 55 ˆ5 4 ˆ54 ˆ10 –4.2 . 100.00 ’0 Swiss Re sigma No 3/2016
Table ¨ Life insurance ‡reiu olue in local currenc€ in 2015 †reiu olue Œ‚ange —in ˜ Œ‚ange —in ˜ —in illions of local currenc€˜ noinal inflation-ad”usted Œountr€ Œurrenc€ 2015 2014 201 2015 2014 2015 2014 Nort‚ ’erica ‹nited „tates 10 ‹„ 2 06 £ 31 0¡0 33 11 ’…0 –0…’ 3…¡ –2…0 —anada 11 — 63 0’ ¿ 60 6’0 ’ ¡0 ’…0 11…1 2…¡ ¡…0 Total . –1.0 Latin ’erica and ¦ra§il ¦˜” 123 61¡ 106 306 ¡’ ¡ 16…3 12…0 6…ƒ …3 Œariƒƒean ‚exico ‚®N 11 ¡1 £ 16¡ 1ƒ £ 1¡ 0 ƒ… 6…’ ’…ƒ 2…3 —hile —”€ ’ ’3 23¡ 3 61 06ƒ 3 ’61 ’¡2 2’…’ … 20… 2…0 rgentina 1¡ ˜„ 32 6¡’ 2’ 3 1ƒ ƒ 3’…2 3ƒ…2 …2 –0…2 —olombia —¢€ 6 3ƒ ’’1 ƒ2ƒ 21¡ 6 ƒƒ ƒƒ0 11…0 –1…6 …ƒ –1…0 €eru €EN 61 ’ ¡2¡ ’ 1’ 1’…0 1ƒ… 10…1 1’…1 ‹ruguay ‹µ‹ 11 6ƒ2 ¡3ƒ ƒ 100 30…6 2…¡ 20…3 1…6 Trinidad and Tobago TT 2 331 ¿ 2 0ƒ2 2 662 12… –22…2 6…6 –26…3 Ecuador ‹„ 3 32 3 ¡…2 –¡…2 ’…¡ –12…’ €anama € ¦ na… 312 20 na… 11…’ na… … uatemala T· 1 1ƒ6 1 1ƒ 1 0ƒ –1…0 12…3 –3…2 …6 —osta ˜ica —˜— ƒ2 12 ƒ6 621 6¡ 62 –… 10…0 –6…ƒ …3 ¨ene§uela ¨E¥ 11¡ ¿ 2 2ƒ¡ 1 6 12’…6 ’…’ –2…ƒ –10…’ ominican ˜epublic ¢€ ’ 16¡ ¿ 3 ƒ¡2 3 03 ¡…¡ …2 ¡…0 …1 —ayman slands –µ na… 2’ 2’ na… 0…ƒ na… –0…¡ Total ˆ.5 .1 uro‡e ‹nited –ingdom ¦€ 1’0 32 ¿ 136 ¡06 1’0 01 2… –2…2 2…’ –3…6 ¥rance E‹˜ 13 31 £ 131 ’ƒ2 121 3 2…¡ …3 2…¡ ƒ… taly E‹˜ 112 1 ¿ 10¡ 323 ¡02 2…¡ 23…0 2…¡ 22…ƒ ermany E‹˜ ƒ 1ƒ3 ¡ 20 6 3’1 –2…3 3…3 –2… 2…’ reland E‹˜ ’2 ƒ33 ¿ 3¡ 0¡ƒ ¿ 31 ƒ’0 ¿ ¡…3 23…2 ¡…3 22… „wit§erland —‘¥ 32 633 £ 32 6’0 32 66 0…0 –0…1 1…1 –0…1 „pain E‹˜ 2 6ƒ ¿ 2’ 3¡ 2 0 2…¡ –2…6 3…’ –2… „weden „E– 20’ 631 1¡3 2¡ 1ƒ ’ …¡ …1 …¡ …3 ”uxembourg E‹˜ 20 ¡ƒ’ £ 23 0 1¡ 62 –10… 1¡… –10… 1…¡ ¥inland E‹˜ 20 03ƒ ¿ 1 66’ 1ƒ 06 ƒ…’ ’… ƒ…6 3…ƒ enmar –– 133 ƒ¡1 ¿ 130 2ƒ 126 2¡ 2…ƒ 3…2 2…2 2…6 Netherlands E‹˜ 16 02 ¿ 1ƒ ’60 1 2ƒ2 –…2 –’…’ –…ƒ –…’ ¦elgium E‹˜ 1 ’¡ ¿ 16 26 16 2ƒ’ –’…’ –0…1 –’…¡ –0…’ Norway N¢– ¡3 63 ¿ ¡2 00 1 ’¡2 1…ƒ 13…0 –0…’ 10…ƒ €ortugal E‹˜ 633 ¿ 10 0 ¿ ¡ 321 ¿ –1ƒ… 12…ƒ –1…2 13…0 ustria E‹˜ 6 ƒ6 6 ƒ’ 6 ’¡¡ 0…2 3…¡ –0…ƒ 2…3 €oland €”N 22 0¡3 £ 23 ’1 26 ’12 –… –11…2 –’…¡ –11…’ —§ech ˜epublic —¹– 62 ’16 £ ƒ1 12 ƒ1 ƒƒ –12…3 –0…6 –12…6 –0…¡ ”iechtenstein —‘¥ 2 2ƒ 2 30 2 ’0 –3…2 –’…1 –2…1 –’…1 ˜ussia ˜‹¦ 12¡ ƒ1 10 31 ’ ¡0 1¡… 2ƒ… 3…’ 1…6 reece E‹˜ 1 ƒ11 £ 1 ƒ1 1 60 –3…¡ 11…0 –2…2 12… ‘ungary ‘‹¥ ’’ƒ 0ƒ £ ’’ 11 ’33 66 –1… ’…ƒ –1…’ ’…¡ Turey T˜µ 3 ƒ00 3 22 3 30 1’…6 –3…6 6… –11… ‚alta E‹˜ na… 1 131 1 0’’ na… …’ na… ƒ… „lovaia E‹˜ 3 ¡6 1 006 –10… –1…¡ –10…2 –1… „lovenia E‹˜ 66 3 3 …ƒ –3…2 6…3 –3…’ ˜omania ˜¢N 1 ƒ0 £ 1 61 1 ƒ0 ¡…’ –0…6 10…1 –1…6 —roatia ‘˜– 2 ¡1¡ £ 2 63 2 3 10…6 3…¡ 11…2 ’…1 —yprus E‹˜ 302 £ 2¡¡ 331 1…0 –¡… 2…6 –¡…6 ¦ulgaria ¦N 331 £ 2¡ 26 1’…ƒ ƒ…¡ 1’… ¡…’ „erbia ˜„ 1ƒ ¡2 £ 1’ ¡6 13 062 20…ƒ 1’…0 1… 11…ƒ ‹raine ‹ ‘ 2 1ƒ 2 160 2 ’ƒƒ 1…2 –12… –31…6 –22…3 Total 1.2 5.ˆ ’sia •apan 13 •€µ ’1 2¡ ƒ20 ¿ ’0 0 200 3 ’2 ¡’0 3…0 ’…3 2… 1…3 €˜ —hina —Nµ 1 32’ 12 £ 1 0¡0 16¡ ¡’2 1’ 21… 1…ƒ 1¡…ƒ 13…’ „outh –orea 13 –˜Œ 113 ƒ1 00 10ƒ 2¡6 00 ¡¡ ƒ¡’ 10 6…0 ƒ… …2 6…3 Taiwan TŒ 2 ’0 ¡ƒ 2 ’03 ’00 2 233 166 …ƒ ƒ…6 6…0 6…’ ndia 13 N˜ 3 ƒ0¡ ¡¡0 ¿ 3 21 012 3 1’2 32 13…1 ’…’ ƒ… –2…1 ‘ong –ong ‘– 31¡ 13 £ 2 0’ 2ƒ ƒ1ƒ 11…¡ 10…¡ …6 6…2 „ingapore „ 22 32 ¿ 20 21 1ƒ 13 …¡ 1…2 ¡… 1’…0 Thailand T‘¦ 00 62 ’ƒ0 060 ’16 0 6… 13…0 ƒ… 10…¡ ndonesia ˜ 1’ƒ 11 000 126 622 000 10¡ 32 ƒ00 16… 1…3 ¡… …’ ‚alaysia ‚µ˜ 3¡ 03ƒ 36 ¡31 3’ ’0ƒ …ƒ ƒ…3 2…ƒ ’… srael 13 ”„ na… 30 ¡¡ 2ƒ 6’ na… 12…0 na… 11…’ €hilippines €‘€ 12 ’ 13 611 162 20 1… –…3 1ƒ…1 –¡…1 ‹nited rab Emirates 12 E ¡’ ¿ ƒ 63 6 ƒ3’ 13… 16… ¡…3 1’…1 ¨ietnam ¨N 3’ 6ƒ 20 2 33 0¡0 23 26 200 22…3 21…¡ 21…2 16…’ €aistan €–˜ 1’¡ 12 ¿ 131 000 ¿ 112 000 ¿ 13…¡ 1ƒ…0 11…0 ¡…1 ¦angladesh ¦T na… ƒ’ ¡0 ¿ 6¡ ’¡ƒ ¿ na… ƒ… na… 0… ‚acao ‚¢€ na… 6 6ƒ ’ ¡6’ na… 3’…1 na… 26… ran 1’ ˜˜ 2 123 2ƒ0 ¿ 21 0 60 1’ ƒ1 ƒ0 16… ’… ’…1 2…¡ ”ebanon ”¦€ 66 12ƒ ¿ 6’2 31 616 0¡6 6… ’…3 10…¡ 3…1 „ri ”ana ”–˜ na… na… na… na… na… na… na… „audi rabia „ ˜ ¡61 ¿ ¡0’ ’ 6…3 ƒ…1 ’…0 ’…3 –a§ahstan –¹T 0’0 ’6 ¡’ 6 ƒ6 1ƒ…1 –1ƒ…0 ¡…¡ –22…1 –uwait –Œ 2 ¿ 0 £ ’¡ ’… 1… 1…2 –1…’ ¦ahrain ¦‘ ƒ ¿ ƒ 63 1…0 –¡…’ –0… –11…ƒ ¢man ¢‚˜ ’ ¿ 36 3’ 22…ƒ …0 22…ƒ 6…¡ •ordan •¢ 61 ¿ 3 ’ƒ 1’…1 11…¡ 1…1 … ·atar · ˜ 262 ¿ 2’ ¿ 230 ¿ … ƒ… ’…1 ’…’ Total ˆ. 5.1 ’frica „outh rica ¹ ˜ ’ƒ ƒ63 ¿ ’’ƒ ’’2 ’03 310 ƒ…0 10…¡ 2…3 ’…6 ‚orocco ‚ 10 61 £ ¡ 3¡¡ ¡¡ 12…’ ¡…3 10… … Egypt 1 E€ ƒ 2ƒ £ 6 213 20 16… 1ƒ…ƒ …2 6…¡ –enya –E„ 6 132 ¿ 6 1 ’’ ’2’ 1…1 2ƒ…’ …0 1¡…2 Nigeria NN 0¡1 ¿ ƒ ’33 6 3 …¡ 16…’ …1 10… lgeria ¹ na… 16 30ƒ 1 02ƒ na… … na… …1 Namibia N 226 ¿ 66 0 20 3…0 6…’ –… –1…6 ngola –¹˜ na… 2ƒ0 221 na… 22…1 na… 16…3 Tunisia TN 10 03’ ¿ 362 ƒ ’ƒ1 20…0 11…¡ 1’…6 …ƒ ‚auritius ‚‹˜ na… £ na… 1 632 na… na… na… na… Total 2. 5.1 –ceania ustralia 20 ‹ 13¡ 62 32ƒ ’ƒ 360 –6…ƒ 31…6 –…1 2…’ New ¹ealand 16 N¹ 2 310 ¿ 2 2¡ 2 1’2 2…2 …’ 1… ’… Total –ƒ… 2ƒ… World World 4.0 4. Swiss Re sigma No 3/2016 ’1
Table ¨ Life ‡reiu olue in ™S“ in 2015 †reiu olue Œ‚ange —in ˜ 2015 S‚are of total S‚are of 1ˆ —in illions of ™S“˜ noinal —in ™S“˜ inflation-ad”usted ƒusiness world ar„et Ran„ing Œountr€ 2015 2014 2015 —in ˜ 2015 —in ˜ Nort‚ ’erica 1 ‹nited „tates 10 2 06 £ 31 0¡0 ’…0 3…¡ ’2…0 21…1 11 —anada 11 ’¡ 331 ¿ ’ ¡0 –10…1 2…¡ ’2…¡ 1…¡ Total 01 ˆ 55 ‹0 2.ˆ . 42.1 2.ˆ5 Latin ’erica and 16 ¦ra§il 3ƒ 106 ’ 16¡ –1ƒ…¡ 6…ƒ 3…ƒ 1…’6 Œariƒƒean 2 ‚exico 11 ’62 £ 12 ƒ0 £ –¡… ’…ƒ ’…’ 0…’ 3’ —hile 6 ¡’6 6 ’01 … 20… 61…3 0…2ƒ 3ƒ rgentina 1¡ 3 2ƒ 2 ¡¡ 1ƒ…ƒ …2 1…2 0…1’ ’1 —olombia 2 31¡ 2 61 –1¡…0 …ƒ 2¡…6 0…0¡ ’’ €eru 1 ƒ2¡ 1 ƒ36 –0…’ 10…1 ’ƒ… 0…0ƒ 63 ‹ruguay ’2 3’ 11…’ 20…3 33…¡ 0…02 6ƒ Trinidad and Tobago 36 ¿ 323 12… 6…6 31… 0…01 6 Ecuador 3 32 ¡…2 ’…¡ 1…¡ 0…01 ƒ0 €anama 33’ ¿¿ 312 ¿¿ ƒ…’ na… 23…¡ 0…01 ƒ6 uatemala 13 ¿¿ 1’ ¿¿ –0… –3…2 1¡…ƒ 0…01 ƒ¡ —osta ˜ica 13 ¿¿ 1’2 ¿¿ –…0 –6…ƒ 12… 0…01 0 ¨ene§uela 11¡ ¿ 1’¡ –20… –2…ƒ 1…6 0…00 ’ ominican ˜epublic ¡1 ¿ ƒ …0 ¡…0 11…’ 0…00 ƒ —ayman slands 31 ¿¿ 2¡ ¿¿ … na… ’…1 0…00 ¢ther countries 1 100 1 0’ 23…’ 0…0’ Total 201 ˆ4 2 –11.5 ˆ.5 41.‹ 2.1 uro‡e 3 ‹nited –ingdom 21’ ’¡2 ¿ 22 ƒ –’…¡ 2…’ 6ƒ…0 …’ƒ ¥rance 10 1’3 £ 1ƒ’ ƒ2¡ –1’…1 2…¡ 6…1 …¡3 6 taly 12’ ’ ¿ 1’ 2¡2 –1’…1 2…¡ ƒ…6 ’…¡3 ermany ¡6 ƒ2 11 –1…’ –2… ’…’ 3…2 12 reland ’ƒ ’16 ¿ 1 ¡61 ¿ –…ƒ ¡…3 …¡ 1…ƒ 1ƒ „wit§erland 33 ¡16 £ 3 6ƒ’ –’…¡ 1…1 …3 1…3’ 1 „pain 2 36 ¿ 33 012 –1’…1 3…’ ’6…3 1…12 1¡ „weden 2’ 261 2 1ƒ¡ –13…¡ …¡ ƒ2…’ 0…¡6 20 ”uxembourg 23 2ƒ2 £ 31 2’3 –2… –10… 6… 0…¡2 21 ¥inland 22 233 ¿ 2’ 0 –10…’ ƒ…6 1…6 0… 22 enmar 1¡ ƒ ¿ 23 1¡1 –1’…2 2…2 6… 0…ƒ 23 Netherlands 1ƒ ƒ ¿ 23 20 –23…’ –…ƒ 22…1 0…ƒ0 2’ ¦elgium 1ƒ 23 ¿ 21 616 –20…2 –’…¡ 2…2 0…6 2ƒ Norway 11 610 ¿ 1’ 61ƒ –20…6 –0…’ …’ 0…’6 31 €ortugal ¡ ƒ¡ ¿ 13 ¡62 ¿ –31…’ –1…2 6ƒ…2 0…3 33 ustria ƒ 0¡ ¡ƒ6 –16…3 –0…ƒ 3…ƒ 0…30 3 €oland ƒ £ ƒ ’36 –21…2 –’…¡ ’1…’ 0…23 3 —§ech ˜epublic 2 3ƒ £ 3 ’2¡ –26…0 –12…6 ’0…ƒ 0…10 ’0 ”iechtenstein 2 36’ 2 6 –ƒ…¡ –2…1 6¡…3 0…0¡ ’2 ˜ussia 2 12¡ 2 2 –2’…ƒ 3…’ 12…ƒ 0…0 ’3 reece 1 ¡¡ £ 2 36ƒ –1¡… –2…2 ’… 0…0ƒ ’ ‘ungary 1 602 £ 1 ¡2 –1ƒ…¡ –1…’ 3…ƒ 0…06 ’¡ Turey 1 361 1 ’ƒ6 –ƒ… 6… 12…2 0…0 0 ‚alta 1 33 ¿¿ 1 03 –11…2 na… ’0…1 0…0 ’ „lovaia ¡0 1 311 –2…2 –10…2 ’’…6 0…0’ ¡ „lovenia 62 ƒ11 –11…ƒ 6…3 2…6 0…02 6’ ˜omania ’2ƒ £ ’66 –… 10…1 20…0 0…02 6 —roatia ’26 £ ’¡ –ƒ…3 11…2 33… 0…02 6¡ —yprus 33 £ 3¡ƒ –1…ƒ 2…6 ’1… 0…01 ƒ3 ¦ulgaria 1 £ 1¡6 –’…2 1’… 1ƒ…6 0…01 ƒ „erbia 16 £ 16 –1…¡ 1… 22…0 0…01 3 ‹raine ¡ 12 –’… –31…6 ƒ…’ 0…00 ¢ther countries ’6 16 16…2 0…02 Total ˆ2 115 1 002 55‹ –1.0 1.2 5‹.4 4.42 ’sia 2 •apan 13 3’3 16 ¿ 36’ 63 –…ƒ 2… ƒ6… 13…ƒ ’ €˜ —hina 210 ƒ63 £ 1ƒ6 ¡0 1¡…1 1¡…ƒ ’… …32 ƒ „outh –orea 13 ¡ 21 101 16 –2…¡ …2 63…¡ 3… ¡ Taiwan ƒ¡ 62ƒ ƒ¡ 16 0…6 6…0 3…0 3…1’ 10 ndia 13 6 6ƒ ¿ 3 6’ …6 ƒ… ƒ¡…0 2…2’ 1’ ‘ong –ong ’1 2 £ 36 ƒ 11…¡ …6 ¡0…2 1…63 2 „ingapore 16 2 ¿ 16 1¡6 0…’ ¡… …1 0…6’ 26 Thailand 1’ 61¡ ¿¿ 1’ ’ƒ2 ¿¿ 1…0 ƒ… 6ƒ…’ 0… 2¡ ndonesia 11 013 ¿¿ 10 6 ¿¿ 3…1 ¡… ƒ3… 0…’3 30 ‚alaysia 13 ¡ 11 01’ –12…¡ 2…ƒ 66… 0…3 32 srael 0¡¡ ¿¿ 63 –6…’ na… 3…0 0…32 36 €hilippines ’ 010 ¿¿ 3 ’60 ¿¿ 1…¡ 1ƒ…1 ƒ2…3 0…16 3¡ ‹nited rab Emirates 12 2 ’36 ¿ 2 1’1 13… ¡…3 2’…1 0…10 ’ƒ ¨ietnam 1 3 ¿¿ 1 33 ¿¿ 1…3 21…2 2… 0…06 ’ €aistan 1 ’1 ¿ 1 2¡6 12…0 11…0 66… 0…06 2 ¦angladesh 1 02 ¿¿ ¡6 ¿ 12…1 na… ƒ3… 0…0’ ‚acao ¡’2 ¿¿ 3’ ¿¿ 13…0 na… ƒ6…1 0…0’ 6 ran †1’‡ 1’ 2 ¿ 12 1…6 ’…1 10… 0…03 61 ”ebanon ’ ¿ ’26 6… 10…¡ 2¡…¡ 0…02 66 „ri ”ana 33 ¿¿ 3ƒ1 ¿¿ 3… na… ’3…0 0…02 ƒ1 „audi rabia 26 ¿ 2’1 6…3 ’…0 2…6 0…01 ƒ2 –a§ahstan 2’ 262 –…3 ¡…¡ 20…¡ 0…01 ƒ’ –uwait 1ƒ’ ¿ 1ƒ6 £ –1…2 1…2 16…6 0…01 ƒƒ ¦ahrain 13 ¿ 11 1…0 –0… 20… 0…01 1 ¢man 116 ¿ ¡ 22…ƒ 22…ƒ 10…3 0…00 •ordan ¿ ƒ 1’…1 1…1 11…0 0…00 6 ·atar ƒ2 ¿ 6 ¿ … ’…1 2… 0…00 ¢ther countries 36 33 1…ƒ 0…01 Total ‹04 5‹ 42 2.0 ˆ. ˆ.0 5.ˆ0 ’frica 1 „outh rica 3ƒ 26 ¿ ’1 21 –¡…0 2…3 1…ƒ 1…’ 1 ‚orocco 1 0’ £ 1 11 –3…1 10… 3’…ƒ 0…0’ 3 Egypt 1 ¡ £ ¡1 10…¡ …2 ’6…¡ 0…0’ ƒ –enya 66’ ¿ 6’’ 3…1 …0 36…¡ 0…03 Namibia 63’ ¿ 66 –ƒ…6 …1 6¡…2 0…03 60 ‚auritius ’¡2 ¿¿ ’0 –… na… 6…ƒ 0…02 62 Nigeria ’’6 ¿ ’0 –1ƒ…’ –… 31…’ 0…02 ƒ Tunisia 1’’ ¿¿ 1¡ –¡…3 na… 1ƒ… 0…01 2 lgeria 100 ¿ 10’ –3… 1’…6 ƒ…¡ 0…00 ngola 1’ £ 1 ¿¿ –1¡…2 na… 1…ƒ 0…00 ¢ther countries 1 611 1 6’ 31… 0…06 Total 4 ˆ04 4ˆ 05 –.2 2. .2 1.ˆ2 –ceania 13 ustralia 20 ’3 663 6 1¡ –22…3 –…1 61…¡ 1…ƒ2 ’6 New ¹ealand 16 1 ¡¡ ¿ 1 ƒ’ –1’…ƒ 1… 1ƒ…0 0…06 ¢ther countries 131 126 2¡… 0…01 Total 45 ‹ 5 15‹ –22.0 –ˆ. 5.4 1.ˆ‹ World World 2 5 1 2 55 5‹ –4. 4.0 55. 100.00 ’2 Swiss Re sigma No 3/2016
Table ¨ Non-life insurance ‡reiu olue in local currenc€ in 2015 †reiu olue Œ‚ange —in ˜ Œ‚ange —in ˜ —in illions of local currenc€˜ noinal inflation–ad”usted Œountr€ Œurrenc€ 2015 2014 201 2015 2014 2015 2014 Nort‚ ’erica ‹nited „tates 10 ‹„ ƒ63 ƒ66 ƒ3¡ 61¡ ƒ21 ¡ 3…3 2… 3…1 0…¡ —anada 11 — 3 ¡3 ¿ ƒ¡ ƒ10 ƒƒ 23¡ …3 3…2 ’…2 1…3 Total .2 0.‹ Latin ’erica and ¦ra§il ¦˜” 106 61 ¿ 100 3ƒ ’ 1’ƒ 6…2 1¡…3 –2…6 12…2 Œariƒƒean rgentina 1¡ ˜„ 1’ƒ 21ƒ 10’ 3 ƒ 00¡ ’1…0 3¡…2 10… 1…3 ‚exico ‚®N 21 ’26 £ 1¡ƒ 12¡ £ 1¡ ¡¡ 10… 3… ƒ…¡ –0…3 ¨ene§uela ¨E¥ 31 ’16 ¿ 1’0 06 ’ 006 12ƒ…3 66…ƒ –1… 2… —olombia —¢€ 1 1’¡ ƒ¡0 13 30 ¡0 12 0’ 60 13… 10… …’ ƒ…’ —hile —”€ 2 6 103 2 ƒ2 213 2 33 ’66 11…’ 10…0 ƒ… 6…’ €eru €EN 6 126 22 ’ 1ƒ…2 ƒ…0 13…2 3…6 Ecuador ‹„ 1 ƒ 1 ¡30 1 ƒ26 –2…ƒ 11… –6… …0 €anama € ¦ 1 066 1 032 ¡6 3…3 6…¡ 2…1 ’…2 —osta ˜ica —˜— ’¡1 ƒ ’ ¡ƒ2 ’’ 3 –¡…¡ 21… –10… 16… ‹ruguay ‹µ‹ 22 0ƒ 21 3’ƒ 1ƒ 6’ 6… 21…0 –1…6 11…1 Trinidad and Tobago TT ’ ¡¡’ ¿ ’ ’¡ 3 30’ 12…0 3…0 6…2 2ƒ…ƒ —ayman slands –µ na… ƒ2 ’0 na… 1¡…2 na… 1ƒ…’ ominican ˜epublic ¢€ 32 312 ¿ 30 02 2ƒ 3 ƒ…6 ¡…0 6…ƒ …¡ uatemala T· ’ ƒ¡0 ’ ’2 ’ 162 ƒ…6 ƒ…0 …2 3… Total 2. .‹ uro‡e ermany E‹˜ 10 02 £ 102 ƒƒ 100 ƒ 2…2 2…0 2…0 1…1 ‹nited –ingdom ¦€ 6¡ 1’3 ¿ 6 10 6 1’ 1… –0…1 1… –1…6 ¥rance E‹˜ ƒ2 ’61 £ ƒ1 3¡0 ƒ0 ƒ6 1… 0…¡ 1… 0…’ Netherlands E‹˜ 6 60ƒ ¿ ƒƒ1 6 60 1… –1… 0…¡ –2…’ taly E‹˜ 36 21¡ ¿ 3ƒ 203 3 2’ –2…6 –2…ƒ –2…ƒ –3…0 „pain E‹˜ 2¡ 6¡3 ¿ 2 ¡2¡ 2 6¡’ 2…6 0… 3…2 1…0 „wit§erland —‘¥ 26 336 £ 26 20 26 1¡3 0… 0…0 1…ƒ 0…1 ¦elgium E‹˜ 1’ 262 ¿ 1’ 2ƒ3 12 2’’ –0…1 16…6 –0…6 16…2 ˜ussia ˜‹¦ ¡’ 10 ƒ¡ 2’2 1¡ ¡ƒ3 1…ƒ ƒ…2 –12…0 –0…6 ustria E‹˜ 10 ƒ1 10 3¡ 10 100 3…2 2…¡ 2…2 1…2 enmar –– ƒ0 60¡ ¿ ƒ0 6ƒ6 62 11 –0…1 12… –0… 11…¡ Turey T˜µ 26 6 22 12¡ 20 32 20…1 …ƒ 11…6 –0…1 „weden „E– ƒƒ ¡’3 £ ƒ2 1 6¡ 111 ƒ…’ …0 ƒ…’ …2 €oland €”N 31 2 £ 30 ¡06 30 ƒ¡ 1…1 0… 2…1 0…3 Norway N¢– 66 6¡ £ 6 ƒ66 62 ƒ’ 1…2 ’… –0…¡ 2…ƒ reland E‹˜ 6 ¡¡2 ¿ 6 6¡ ¿ 6 ’61 ¿ …0 3…1 …0 2… ¥inland E‹˜ ’ 1¡ ¿ ’ ’0’ ’ 1’¡ 2…6 6…1 2… …1 €ortugal E‹˜ ’ 221 ¿ 3 ¡0’ ¿ 3 ¡0’ ¿ …1 0…0 ƒ…6 0…3 —§ech ˜epublic —¹– ¡0 ¡0 £ 6 ƒ36 ’ ¡’ƒ ’…¡ 2…1 ’… 1…ƒ ”uxembourg E‹˜ 3 11 £ 2 ¡1’ 2 0 ¡…1 2…2 ¡…1 1… reece E‹˜ 2 022 £ 2 1¡ 2 ’0 –ƒ…6 –¡…1 –6…0 –ƒ…¡ ‚alta E‹˜ na… 1 6ƒ 1 31 na… 10…2 na… ¡…3 ˜omania ˜¢N 6 1 £ 6 2’ 6 2 …0 –0…’ …6 –1… „lovenia E‹˜ 1 ’0¡ 1 ’02 1 ’2 0… –1…6 1…1 –1… ‘ungary ‘‹¥ 3 116 £ 361 0¡6 3’ 621 6…ƒ ’… 6…ƒ ’…ƒ ‹raine ‹ ‘ 2ƒ ’¡ 2’ 60 26 1 12…0 –6…0 –2’…’ –16…2 „lovaia E‹˜ 1 0¡ 1 0¡1 1 0 0…6 3…1 0…¡ 3…2 ”iechtenstein —‘¥ 1 00ƒ 1 060 ¡30 –…0 1’…0 –3…¡ 1’…0 ¦ulgaria ¦N 1 £ 1 ’’3 1 3¡6 ƒ…ƒ 3…’ ƒ…¡ ’…¡ —roatia ‘˜– ƒ¡0 £ ¡2’ 6 3 –2…3 –¡…’ –1… –¡…2 „erbia ˜„ 63 60 £ ’ 0¡ 0 ¡0 1ƒ…2 6…¡ 1…3 ’…ƒ —yprus E‹˜ ’2 £ ’23 ’31 0…’ –1… 2…0 –1…6 Total 1.1 0. ’sia €˜ —hina —Nµ 1 10’ 100 £ ¡33 313 ƒƒ¡ ƒ10 1…3 1¡…ƒ 16…6 1ƒ…’ •apan 13 •€µ 12 ƒ1 30 ¿ 12 30¡ ƒ0 11 0’ 0 3…3 ƒ…0 3…1 3…¡ „outh –orea 13 –˜Œ 6’ 11 600 61 20¡ 20 ¡ 32 320 ’…¡ 3…1 ’…0 2…0 Taiwan TŒ 21 0¡ ’¡¡ ¡0 ’ƒ 2ƒ0 ’…’ …2 ’…ƒ 3…¡ ndia 13 N˜ ¡ 20 ¿ ƒ1 1’ ƒ¡¡ 3’2 13…’ ¡…0 …1 2…2 „ingapore „ 16 1’¡ ¿ 1’ 336 13 ’62 12…6 6… 13…2 …’ „audi rabia „ ˜ 36 12¡ ¿ 2¡ ƒ 2’ 3¡ 22…1 21…2 1¡…6 1…1 ‹nited rab Emirates 12 E 2 121 ¿ 2’ 22 ’ƒ3 13…0 10…ƒ …6 …2 srael ”„ na… 2ƒ 0’ 26 3¡2 na… ’…2 na… 3…ƒ Thailand T‘¦ 2’1 2 23’ 63 22 3¡1 3…1 2… ’…0 0… ran 1’ ˜˜ 21’ ƒ¡2 00 ¿ 13 ¡0 ¡00 1’ƒ 2ƒ’ 000 16… 2’…¡ ’…1 …1 ‚alaysia 13 ‚µ˜ 1¡ 3¡ 1 ’ƒ 1ƒ 6’0 2…¡ 6… –0…1 ’…3 ‘ong –ong ‘– 3’ 3 £ 32 203 30 ¡2 …2 ’…1 …0 –0…3 ndonesia ˜ 2 ’ ¡0 ’ƒ 010 30 ’’ 101 00 11…6 6…6 ’…¡ 0…2 ·atar · ˜ 10 00 ¿ ¡ ’¡ ƒ 030 … 3…1 ’…1 30… €hilippines €‘€ ƒ0 0’3 61 1’1 3 61 1’…6 1’…2 13…0 ¡…6 ¨ietnam ¨N 30 ¡ƒ3 0 2ƒ 30ƒ ’0 2’ 20 0 13…’ 11…’ 12…’ 6…’ ”ebanon ”¦€ 1 606 3¡ ¿ 1 0 ¡3 1 1 22 1…6 ’…1 … 2…¡ ¢man ¢‚˜ 3 ¿ 361 330 ƒ…2 ¡…’ ƒ…1 …3 –a§ahstan –¹T 20 26¡ 1¡ ’2ƒ 1¡6 ’¡ƒ ¡…¡ –3…6 3…2 –¡…6 –uwait –Œ 263 ¿ 22 £ 22 ’… 10…3 1…2 ƒ…2 €aistan €–˜ ƒ 102 ¿ 6 ’00 6’ 000 ¡… 6…¡ ƒ…1 –0…3 •ordan •¢ ’¡2 ¿ ’ƒ3 ’’3 ’…0 6…6 ’…¡ 3…6 ¦ahrain ¦‘ 223 ¿ 21’ 1¡6 ’…3 ¡…3 2…’ 6… „ri ”ana ”–˜ na… na… na… na… na… na… na… ¦angladesh ¦T na… 2ƒ 0’ ¿ 23 ¡20 ¿ na… 13…1 na… …ƒ ‚acao ‚¢€ na… 2 0¡0 1 61 na… 12…3 na… …¡ Total ‹.2 . ’frica „outh rica ¹ ˜ 10ƒ ƒ 100 32 ¡’ 3ƒ2 ƒ…2 6…3 2… 0…3 ‚orocco ‚ 1¡ 63 £ 1¡ 023 1 13 ’…’ ’…¡ 2…ƒ ’…’ lgeria ¹ 116 32 ¿ 110 3’ 103 20 …3 ƒ…0 0… ’…0 –enya –E„ 111 2’¡ ¿ ¡¡ 1ƒ6 ’ ƒ66 12…2 1ƒ…0 …2 ¡… Egypt 1 E€ 226 £ ƒ ’ƒ 6 ¡’ ¡…0 … –1… –1…’ Nigeria NN 1¡2 ¡1 ¿ 1¡ ’ƒ 1¡6 00¡ –3…0 1…3 –11…0 –6…3 ngola ¢ na… na… ¡ ¡ƒ’ na… na… na… na… Tunisia TN na… 1 2ƒ0 1 1ƒ6 na… …0 na… 2…¡ Namibia N 3 602 ¿ 3 33 2 ƒ ƒ…¡ 1¡…ƒ ’…2 13…ƒ ‚auritius ‚‹˜ na… 0¡ ƒ 02¡ na… 21…1 na… 1ƒ…3 Total 1. 1.2 –ceania ustralia 20 ‹ 3 0 3 1’1 33 ’2 2…0 3… 0… 1…3 New ¹ealand 16 N¹ 11 2ƒ1 ¿ 11 36 11 236 –0…¡ 1…2 –1…2 0…2 Total 0.1 1.1 World World . 2.4 Swiss Re sigma No 3/2016 ’3
Table ¨ Non-life ‡reiu olue in ™S“ in 2015 †reiu olue Œ‚ange —in ˜ 2015 S‚are of total S‚are of 1ˆ —in illions of ™S“˜ noinal —in ™S“˜ inflation-ad”usted ƒusiness world ar„et Ran„ing Œountr€ 2015 2014 2015 —in ˜ 2015 —in ˜ Nort‚ ’erica 1 ‹nited „tates 10 ƒ63 ƒ66 ¿¿ ƒ3¡ 61¡ 3…3 3…1 …0 3ƒ…1 ƒ —anada 11 6 63ƒ ¿ ƒ2 12 –¡…0 ’…2 ƒ…1 3…2 Total 2‹ 402 11 ˆˆ1 2.2 .2 5ˆ.‹ 41.0 Latin ’erica and 12 ¦ra§il 31 ¡6 ¿ ’2 6’2 –2…0 –2…6 ’6…3 1… Œariƒƒean 16 rgentina 1¡ 1 2 12 ’ƒ 23…6 10… 1… 0…ƒ¡ 20 ‚exico 13 ƒ63 £ 1’ 0 £ –ƒ…1 ƒ…¡ ’…6 0…6 33 ¨ene§uela ƒ 32 ¿ ¡ 1ƒ0 –1¡… –1… ¡…’ 0…3ƒ 3ƒ —olombia 2 6 6’¡ –16…¡ …’ ƒ0…’ 0…2ƒ ’2 —hile ’ 30 ’ 10 –2…¡ ƒ… 3…ƒ 0…22 0 €eru 1 6 1 ’1 2… 13…2 2…2 0…0¡ 1 Ecuador 1 ƒ 1 ¡30 –2…ƒ –6… ’…1 0…0¡ 62 €anama 1 066 ¿¿ 1 032 ¿¿ 3…3 2…1 ƒ6…1 0…0 6 —osta ˜ica ¡21 ¿¿ 1 01’ ¿¿ –¡…2 –10… ƒ…2 0…0 ƒ3 ‹ruguay 3ƒ ¡1 –…¡ –1…6 66…1 0…0’ ƒ’ Trinidad and Tobago ƒ2 ¿ 6¡6 12…3 6…2 6…2 0…0’ ƒ6 —ayman slands ƒ26 ¿¿ 6ƒ ¿¿ … na… ¡…¡ 0…0’ ƒƒ ominican ˜epublic ƒ0¡ ¿ 6¡ 2… 6…ƒ …6 0…0’ 0 uatemala 623 ¿¿ ƒ6 ¿¿ …1 …2 0…3 0…03 ¢ther countries 3 601 3 ’ ƒ6…6 0…1 Total ‹1 ‹45 10 4‹5 –11.2 2. 5.1 4.55 uro‡e 3 ermany 116 3 £ 136 66 –1’…ƒ 2…0 ’…6 …ƒƒ ‹nited –ingdom 10 6 ¿ 112 221 –… 1… 33…0 …23 6 ¥rance 0 ’02 £ ¡’ ƒ¡ –1…3 1… 3’…¡ 3…¡ Netherlands 62 10 ¿ ƒ’ 120 –1…3 0…¡ ƒƒ…¡ 3…11 10 taly ’0 1¡ ¿ ’¡ ’’3 –1…ƒ –2…ƒ 2’…’ 1…¡¡ 11 „pain 32 ¡’ƒ ¿ 3 ’’ –1’…3 3…2 3…ƒ 1…63 13 „wit§erland 2ƒ 3ƒ2 £ 2 6’1 –’…’ 1…ƒ ’’…ƒ 1…36 1ƒ ¦elgium 1 2’ ¿ 1 ¡6¡ –16…6 –0…6 ’ƒ… 0…ƒ 1¡ ˜ussia 1’ 6ƒ2 22 ¡10 –36…0 –12…0 ƒ…3 0…ƒ3 21 ustria 11 ¡3 13 0ƒ –13…¡ 2…2 61…3 0…¡ 23 enmar 10 ’¡ ¿ 12 1 –16…6 –0… 3’… 0…2 2’ Turey ¡ ƒƒ¡ 10 11¡ –3…’ 11…6 ƒ… 0…’ 26 „weden ¡ 2’1 £ 10 1 –12…ƒ ƒ…’ 2ƒ…6 0…’6 2 €oland 2ƒ £ ¡ 00 –1…’ 2…1 …6 0…’1 2¡ Norway 2’ £ 10 ’’3 –21…0 –0…¡ ’1…6 0…’1 31 reland ƒ ƒ¡ ¿ 0 ¿ –12…3 …0 1’…1 0…3 3 ¥inland 01’ ¿ 3 –1’…3 2… 1…’ 0…2 ’0 €ortugal ’ 6’ ¿ 1¡ ¿ –¡…ƒ ƒ…6 32… 0…23 ’’ —§ech ˜epublic 3 6¡¡ £ ’ 1ƒ¡ –11… ’… ¡…3 0…1 ’ ”uxembourg 3 2¡ £ 3 ƒ3 –…¡ ¡…1 13…2 0…1ƒ ’ƒ reece 2 2’’ £ 2 ¡0¡ –22…¡ –6…0 ’…2 0…11 ’¡ ‚alta 1 ¡¡0 ¿¿ 2 2’1 –11…2 na… ¡…¡ 0…10 2 ˜omania 1 ƒ10 £ 1 ¡’ –12…2 …6 0…0 0…0 3 „lovenia 1 6’ 1 63 –16…1 1…1 ƒ1…’ 0…0 6 ‘ungary 1 3ƒ¡ £ 1 2 –11…2 6…ƒ ’6…3 0…0ƒ ƒ ‹raine 1 2’1 2 0ƒ0 –’0…1 –2’…’ ¡2…6 0…06 „lovaia 1 21 1 ’0 –16…0 0…¡ …’ 0…06 6’ ”iechtenstein 1 0’ƒ 1 1¡ –¡…ƒ –3…¡ 30…ƒ 0…0 6¡ ¦ulgaria 1 £ ¡ƒ¡ –10…0 ƒ…¡ 2…’ 0…0’ ƒ1 —roatia ’’ £ 1 031 –1…1 –1… 66… 0…0’ 2 „erbia ƒ £ 61ƒ –’… 1…3 ƒ…0 0…03 ’ —yprus ’ƒ1 £ 62 –16…2 2…0 … 0…02 ¢ther countries 2 1 2 61 3… 0…12 Total 5‹ ˆ ‹2 5 –1. 1.1 40. 2‹.54 ’sia 2 €˜ —hina 1ƒ ƒ3ƒ £ 11 ’¡0 16…0 16…6 ’… …ƒ0 ’ •apan 13 10 ¡1 ¿ 111 ¡2 –…’ 3…1 23… …2’ ¡ „outh –orea 13 ’02 ƒ ƒ13 –’…0 ’…0 36…1 2…ƒ’ 1 Taiwan 16 32 16 ’66 –0…ƒ ’…ƒ 1ƒ…0 0…1 1 ndia 13 1 101 ¿ 1’ 22 6…0 …1 21…0 0…ƒ 22 „ingapore 11 ƒ’6 ¿ 11 31 3… 13…2 ’1…¡ 0… 2 „audi rabia ¡ 63’ ¿ ƒ ƒ 22…1 1¡…6 ¡ƒ…’ 0…’ 32 ‹nited rab Emirates 12 ƒ 6ƒ ¿ 6 ƒƒƒ 13…0 …6 ƒ…¡ 0…3 3’ srael ƒ 1¡ ¿¿ ƒ 6ƒ –6…’ na… ’ƒ…0 0…36 3 Thailand ƒ 063 ¿¿ ƒ 22 ¿¿ –2…3 ’…0 32…6 0…3 36 ran 1’ ƒ 02 ¿ 6 ¡’1 1…6 ’…1 ¡… 0…3 3¡ ‚alaysia 13 ’ ƒ62 621 –1…3 –0…1 33…2 0…2’ ’1 ‘ong –ong ’ ’¡’ £ ’ 13 …2 …0 ¡… 0…22 ’3 ndonesia 3 ¡16 ¿¿ 3 ¡6ƒ ¿¿ –1…3 ’…¡ 26…2 0…1¡ ’6 ·atar 2 ƒ61 ¿ 2 60¡ … ’…1 ¡ƒ… 0…1’ ’ €hilippines 1 3¡ ¿¿ 1 3ƒƒ ¿¿ 11… 13…0 2ƒ…ƒ 0…0 ¨ietnam 1 ’1’ ¿¿ 1 2¡ ¿¿ ¡…ƒ 12…’ ’ƒ…2 0…0ƒ 63 ”ebanon 1 066 ¿ 1 0’¡ 1…6 … ƒ0…1 0…0 6 ¢man 1 00 ¿ ¡’0 ƒ…2 ƒ…1 ¡…ƒ 0…0 6ƒ –a§ahstan ¡3¡ 1 0ƒ –11…1 3…2 ƒ¡…1 0…0 ƒ0 –uwait ƒ’ ¿ ’ £ –1…2 1…2 3…’ 0…0’ ƒ €aistan ƒ31 ¿ 6ƒƒ …0 ƒ…1 33… 0…0’ ƒ •ordan 6¡2 ¿ 666 ’…0 ’…¡ ¡…0 0…03 1 ¦ahrain ¡3 ¿ 6¡ ’…3 2…’ ƒ¡… 0…03 3 „ri ”ana 0 ¿¿ ’¡1 ¿¿ 3… na… ƒ…0 0…03 ¦angladesh 3¡0 ¿¿ 3’ ¿ 12…1 na… 26… 0…02 6 ‚acao 2¡6 ¿¿ 262 ¿¿ 13…0 na… 23…¡ 0…01 ¢ther countries 1 ¡ 1 ƒ’ƒ 1…3 0…0 Total 44 405 42ˆ 411 4.4 ‹.2 .0 22.10 ’frica 2ƒ „outh rica ’32 ¡ 22 –…¡ 2… 1…3 0…’2 ’ ‚orocco 2 03 £ 2 263 –¡…¡ 2…ƒ 6…3 0…10 ¡ lgeria 1 162 ¿ 1 3ƒ2 –1…3 0… ¡2…1 0…06 60 –enya 1 133 ¿ 1 12 0… …2 63…1 0…06 61 Egypt 1 1 120 £ 1 03 3…’ –1… 3…1 0…06 66 Nigeria ¡ƒ’ ¿ 1 22 –22…2 –11…0 6…6 0…0 ƒ2 ngola 3 ¿¿ 1 03ƒ ¿¿ –1¡…2 na… ¡…3 0…0’ ƒ¡ Tunisia 6ƒ¡ ¿¿ ƒ’ –¡…3 na… 2… 0…03 ƒ Namibia 22 ¿ 30 –…’ ’…2 30… 0…01 ‚auritius 2ƒ ¿¿ 22 –… na… 3’…3 0…01 ¢ther countries 3 03 3 ƒ6 6… 0…1ƒ Total 20 41‹ 22 511 –‹. 1. 1. 1.01 –ceania 1’ ustralia 20 26 ¡2’ 31 663 ¿¿ –1…0 0… 3…1 1…33 30 New ¹ealand 16 ƒ 00 ¿ ¡ ’30 –1ƒ…3 –1…2 3…0 0…3¡ ¢ther countries 30¡ 30’ ƒ0…2 0…02 Total 5 0 41 ‹ –15.4 0.1 4. 1.ˆ World World 2 01‹ ‹ˆ 2 0‹‹ 11 –. . 44.4 100.00 ’’ Swiss Re sigma No 3/2016
1 Table ¨ ‰nsurance densit€: ‡reius ‡er ca‡ita in ™S“ in 2015 Ran„ing Œountr€ Total ƒusiness Life ƒusiness Non-life ƒusiness Nort‚ ’erica ¡ ‹nited „tates 10 ’ 0¡… ¿¿ 1 ƒ1¡…2 £ 2 3ƒ6…6 ¿¿ 1ƒ —anada 11 3 20¡…1 ¿ 1 3ƒƒ…0 ¿ 1 32…1 ¿ Total 4 00.‹ 1 4.‹ 2 22.0 Latin ’erica and Œariƒƒean 1 —ayman slands 12 61¡…3 ¿¿ 1’… ¿¿ 12 10’…6 ¿¿ 3’ Trinidad and Tobago ’3…0 ¿ 26…2 ¿ ƒ’…ƒ ¿ 36 —hile 630…3 36… 2’3…ƒ ’1 rgentina ’’6… 1…1 36…’ ’6 ‹ruguay 36…ƒ 12’… 2’3…¡ ’ƒ €anama 36…’ ¿¿ …1 ¿¿ 2ƒ1…2 ¿¿ ’ ¦ra§il 332…1 ¿ 1ƒ…3 13…ƒ ¿ ƒ ¨ene§uela 2’1…1 ¿ 3… ¿ 23ƒ…3 ¿ —osta ˜ica 21¡…ƒ ¿¿ 2…1 ¿¿ 1¡1…6 ¿¿ ¡ ‚exico 1¡…3 £ ¡0…1 £ 10…2 £ 60 —olombia 162…6 ’…1 11’…6 63 Ecuador 13…3 22…0 116…3 6 €eru 11…2 …1 60…1 ƒ1 ominican ˜epublic ƒ6…0 ¿ …ƒ ¿ 6ƒ…3 ¿ ƒƒ uatemala ’ƒ…’ ¿¿ ¡…’ ¿¿ 3…1 ¿¿ Total 251.0 105.1 145.‹ uro‡e 2 „wit§erland ƒ 3ƒ0…3 £ ’ 0ƒ…6 £ 3 2¡1…ƒ £ ’ ”uxembourg 1 ’01…3 £ 3 3…3 £ 1 66…1 £ ¥inland ’ ¡63…2 ¿ ’ 0’¡…¡ ¿ ¡13…3 ¿ 6 enmar ’ ¡1’…2 ¿ 3 13…3 ¿ 1 ’00… ¿ ƒ Netherlands ’ ƒ63…1 ¿ 1 01…1 ¿ 3 ƒ12…1 ¿ ‹nited –ingdom 1 ’ 3… ¿ 3 2¡1… ¿ 1 066…ƒ ¿ 11 reland 1 3 ¡2ƒ…0 ¿ 3 1ƒ2… ¿ ƒ’…2 ¿ 13 Norway 1 3 6… ¿ 2 23…3 ¿ 1 330…2 £ 1 „weden 3 ’2¡… £ 2 ’3… ¡’6…0 £ 16 ¥rance 1 3 3¡2…0 £ 2 263…0 £ 1 12¡…0 £ 20 ¦elgium 1 2 6…¡ ¿ 1 21…0 ¿ 1 066…0 ¿ 21 taly 1 2 0… ¿ 1 ¡6…3 ¿ 612…2 ¿ 22 ermany 1 2 62… £ 1 11…1 1 31…’ £ 23 ustria 2 260…ƒ ƒ’…¡ 1 3…ƒ 2ƒ €ortugal 1 362…2 ¿ ¡1ƒ…0 ¿ ’’…2 ¿ 2 „pain 1 321… ¿ 611… ¿ ƒ10…2 ¿ 31 „lovenia 1 0…2 303…2 ƒ…0 32 ‚alta ¡’…ƒ ¿¿ 631…1 ¿¿ 31ƒ…6 ¿¿ 33 —yprus ¡22… £ 32…¡ £ 3¡…6 £ 3ƒ —§ech ˜epublic ¡1… £ 2’0… £ 31…0 £ ’2 „lovaia ’0…6 10…¡ 22’… ’3 reece 31…3 £ 1ƒ’… £ 206… £ ’ €oland 3ƒ1…ƒ £ 13…¡ £ 21ƒ… £ 1 ‘ungary 302… £ 162… £ 1’0…1 £ 2 —roatia 2¡… £ 100…1 £ 1¡…ƒ £ 61 ¦ulgaria 1’¡…3 £ 26…2 £ 123…1 £ 62 Turey 1’1…’ 1ƒ…3 12’…1 6’ ˜ussia 11ƒ…1 1’… 102…3 66 ˜omania 10ƒ…’ £ 21…’ £ 6…0 £ 6ƒ „erbia 10…0 £ 23…1 £ 1…¡ £ 3 ‹raine 2¡…¡ 2…2 2ƒ…ƒ ”iechtenstein Total 1 63’…’ ¡ƒ…2 6’ƒ…2 ’sia 3 ‘ong –ong 6 2ƒ1…2 £ 6…2 £ 616…0 £ 10 Taiwan ’ 0¡’…1 3 3¡6…6 6¡ƒ… 12 „ingapore 1 3 2…1 ¿ 2 ¡31… ¿ ¡3…ƒ ¿ 1’ •apan 13 3 3… ¿ 2 ƒ1ƒ…0 ¿ 36… ¿ 1 „outh –orea 13 3 03’…2 1 ¡3¡…¡ 1 0¡’…3 2’ ‚acao 2 103…¡ ¿¿ 1 601…2 ¿¿ 02…ƒ ¿¿ 26 srael 1 ¡6…ƒ ¿¿ 1 00’…’ ¿¿ ¡2…3 ¿¿ 2¡ ·atar 1 26ƒ…6 ¿ 32…3 ¿ 1 23…’ ¿ 30 ‹nited rab Emirates 12 1 102…2 ¿ 266…0 ¿ 36…2 ¿ 3¡ ¦ahrain ’…ƒ ¿ 11¡…ƒ ¿ ’6’…¡ ¿ ’0 ‚alaysia 13 ’ƒ2…3 31…6 16…ƒ ’¡ Thailand 31…¡ ¿¿ 21…1 ¿¿ 103…¡ ¿¿ 0 „audi rabia 313…6 ¿ …1 ¿ 30… ¿ 3 €˜ —hina 20…ƒ £ 13…1 £ 12ƒ…6 £ ’ –uwait 26¡…1 ¿ ’’…6 ¿ 22’… ¿ ”ebanon 2¡…¡ ¿ ƒƒ… ¿ 12…1 ¿ 6 ¢man 20…3 ¿ 2… ¿ 22’…’ ¿ 6 •ordan 102…’ ¿ 11…2 ¿ ¡1…2 ¿ 6¡ ran 1’ ¡¡…6 ¿ 10…’ ¿ ¡…1 ¿ ƒ3 –a§ahstan 6ƒ…’ 1’…1 3…3 ƒ’ ndonesia ƒ…¡ ¿¿ ’2…ƒ ¿¿ 1…2 ¿¿ ƒ €hilippines …0 ¿¿ 3¡… ¿¿ 1…3 ¿¿ ƒ6 ndia 13 ’…ƒ ¿ ’3…2 ¿ 11… ¿ ƒ „ri ”ana ’3…1 ¿¿ 1… ¿¿ 2’… ¿¿ 1 ¨ietnam 32…1 ¿¿ 16…¡ ¿¿ 1…1 ¿¿ €aistan 11… ¿ ƒ…ƒ ¿ 3…¡ ¿ 6 ¦angladesh ¡…1 ¿¿ 6…ƒ ¿¿ 2…’ ¿¿ Total 311…ƒ 20¡… 102…0 ’frica 3 „outh rica ’2… ¿ 6ƒ…¡ ¿ 1’…6 3 ‚auritius …ƒ ¿¿ 36… ¿¿ 201…¡ ¿¿ ’’ Namibia 3ƒ2…ƒ ¿ 2ƒ…¡ ¿ 11’… ¿ ƒ0 ‚orocco ¡0… £ 31… £ ¡…3 £ ƒ2 Tunisia ƒ3…1 ¿¿ 12… ¿¿ 60…3 ¿¿ ƒ¡ –enya 3¡…0 ¿ 1’…’ ¿ 2’…6 ¿ 0 ngola 3’…1 ¿¿ 0…6 £ 33… ¿¿ 2 lgeria 31… ¿ 2… ¿ 2¡…3 ¿ ’ Egypt 1 23…0 £ 10… £ 12…2 £ ƒ Nigeria ƒ… ¿ 2…’ ¿ …3 ¿ Total 54.ˆ ˆ. 1ˆ.4 –ceania 1¡ ustralia 2 ¡ƒ…ƒ 1 2¡…6 1 12…2 2 New ¹ealand 2 0ƒ…2 ¿ 33…0 ¿ 1 ƒ22…2 ¿ Total 2 06…0 1 16… ¡¡… World World 3 621…2 3’…ƒ 2ƒ…6 Swiss Re sigma No 3/2016 ’
1 Table IX Insurance penetration: premiums in % of GDP in 2015 Ranking Country ota usiness ife usiness onife usiness ort merica 15 Canada 11 7.40 * 3.18 * 4.23 * 16 United States 10 7.28 ** 3.05 + 4.22 ** ota €‚2ƒ „‚0… †‚22 atin merica an‡ Cariean 1 Caan Islands 20.24 ** 0.83 ** 1.42 ** 34 Cile 4.74 2.1 1.83 35 Tinidad and Tobao 4.44 * 1.41 * 3.03 * 38 ene€ela 3.5 * 0.06 * 3.8 * 3 ‚ail 3.0 * 2.0 1.80 * 44 ƒentina 3.26 0.5 2.66 47 „anaa 2.5 ** 0.71 ** 2.25 ** 4 Colobia 2.64 0.78 1.86 55 U€€a 2.34 0.7 1.55 56 …†€ado 2.26 0.36 1.0 57 ‡eˆi†o 2.21 + 1.00 + 1.20 + 63 Costa ‰i†a 2.04 ** 0.26 ** 1.78 ** 64 „e€ 1.2 0.2 1.00 77 Š€ateala 1.24 ** 0.24 ** 0. ** 78 ‹oini†an ‰eŒ€bli† 1.21 * 0.14 * 1.07 * ota „‚0ƒ 1‚2ƒ 1‚ˆ0 ‰urope 5 Žinland 11.86 * .68 * 2.18 * 8 Netelands 10.72 * 2.36 * 8.35 * United ‘indo 1 .7 * 7.53 * 2.44 * 10 ‹ena’ .43 * 6.74 * 2.6 * 11 Žan†e 1 .2 + 6.20 + 3.0 + 12 S“iteland .22 + 5.10 + 4.12 + 13 Ital 1 8.68 * 6.62 * 2.06 * 14 Ieland 1 7.87 * 6.36 * 1.51 * 18 „ot€al 7.10 * 4.78 * 2.32 * 20 S“eden 6.81 + 4.3 1.88 + 22 ‚eli€ 1 6.42 * 3.78 * 2.65 * 23 Šean 1 6.24 + 2.88 3.36 + 24 No“a 1 5.3 * 3.72 * 2.21 + 2 ƒ€stia 5.1 2.01 3.18 30 ”€ˆebo€ 1 5.17 + 3.38 + 1.7 + 31 SŒain 5.11 * 2.36 * 2.75 * 33 Slo•enia 5.01 1.43 3.57 36 ‡alta 4.25 ** 2.83 ** 1.42 ** 37 CŒ€s 4.18 + 1.73 + 2.44 + 43 Ce† ‰eŒ€bli† 3.27 + 1.33 + 1.4 + 48 „oland 2.4 + 1.22 + 1.72 + 50 Coatia 2.62 + 0.88 + 1.74 + 52 –€na 2.45 + 1.32 + 1.13 + 53 Slo•a’ia 2.40 1.07 1.33 58 ‚€laia 2.18 + 0.38 + 1.80 + 60 Šee†e 2.13 + 0.7 + 1.15 + 61 Sebia 2.05 + 0.45 + 1.60 + 71 T€’e 1.55 0.1 1.36 74 U’aine 1.41 0.10 1.31 75 ‰€ssia 1.36 0.17 1.1 76 ‰oania 1.28 + 0.26 + 1.03 + 88 ”ie†tenstein ota …‚ˆƒ †‚1… 2‚€„ sia 2 Tai“an 18.7 15.74 3.23 3 –on ‘on 14.76 + 13.31 + 1.45 + 6 So€t ‘oea 13 11.42 7.30 4.12 7 —aŒan 13 10.82 * 8.27 * 2.55 * 17 SinaŒoe 1 7.25 * 5.55 * 1.6 * 27 Tailand 5.4 ** 3.70 ** 1.7 ** 28 Isael 5.35 ** 2.83 ** 2.51 ** 32 ‡alasia 13 5.05 3.37 1.68 40 „‰ Cina 3.57 + 1.5 + 1.63 + 41 India 13 3.44 * 2.72 * 0.72 * 42 ”ebanon 3.42 * 1.02 * 2.40 * 51 ‚aain 2.45 * 0.50 * 1.5 * 54 United ƒab …iates 12 2.35 * 0.57 * 1.78 * 5 —odan 2.13 * 0.23 * 1.8 * 62 Ian 14 2.04 * 0.21 * 1.83 * 66 „iliŒŒines 1.0 ** 1.37 ** 0.53 ** 67 ‡a†ao 1.86 ** 1.42 ** 0.45 ** 68 Indonesia 1.73 ** 1.28 ** 0.45 ** 6 ˜an 1.57 * 0.16 * 1.41 * 70 ietna 1.57 ** 0.83 ** 0.74 ** 72 ™ata 1.54 * 0.04 * 1.50 * 73 Sa€di ƒabia 1.51 * 0.04 * 1.47 * 7 Si ”an’a 1.15 ** 0.4 ** 0.66 ** 80 ‘€“ait 0.0 * 0.15 * 0.75 * 82 „a’istan 0.82 * 0.54 * 0.27 * 84 ‘aa’stan 0.71 0.15 0.56 86 ‚anlades 0.67 ** 0.50 ** 0.18 ** ota 5‚„† „‚5ƒ 1‚€† frica 4 So€t ƒši†a 14.6 * 12.00 * 2.70 1 Naibia 6.8 * 4.83 * 2.15 * 21 ‡a€iti€s 6.43 ** 4.22 ** 2.20 ** 45 ‡oo††o 3.05 + 1.06 + 1. + 46 ‘ena 2.8 * 1.10 * 1.88 * 65 T€nisia 1.1 ** 0.34 ** 1.58 ** 81 ƒleia 0.82 * 0.07 * 0.76 * 83 ƒnola 0.81 ** 0.01 + 0.80 ** 85 …Œt 15 0.68 + 0.32 + 0.36 + 87 Nieia 0.2 * 0.0 * 0.20 * ota 2‚ƒ0 1‚ƒ€ 0‚ƒ2 Šceania 25 ƒ€stalia 5.67 3.51 2.16 26 Ne“ ›ealand 5.5 * 0.5 * 4.64 * ota 5.58 3.15 2.43 ‹or‡ ‹or‡ „ …‚2„ „‚†€ 2‚€€ 46 Swiss Re sigma No 3/2016
Table ® ‘acroeconoic indicators in 2015 Žross doestic ‡roduct †o‡ulation Real c‚ange c‚ange rate Ran„ing —illions˜ ™S“ ƒn —in ˜ ‰nflation rate —in ˜ local currenc€ ‡er ™S“ Œ‚ange ƒ€ Ž“† Œountr€ 2015 2015 2015 2014 2015 2014 2015 2014 —in ˜ Nort‚ ’erica 1 ‹nited „tates 321…’ 1 0¡…¡ 2…’ 2…’ 0…1 1…6 1…00 1…00 0…0 10 —anada 3… 1 2… 1…2 2… 1…1 1…¡ 1…2 1…10 1… Total 5ˆ.2 1‹ 42. 2. 2.4 Latin ’erica and ¡ ¦ra§il 20…1 1 ƒƒ2…3 –3… 0…1 ¡…0 6…3 3…33 2…3 ’1…6 Œariƒƒean 1 ‚exico 12ƒ…2 1 1’2…’ 2… 2…3 2…ƒ ’…0 1…ƒ 13…31 1¡…2 21 rgentina 1¡ ’3… ¡6…2 1…3 0… 2ƒ…6 3ƒ…’ ¡…2ƒ …13 1’…1 3 —olombia ’…2 2¡ƒ…1 3…0 ’…6 …0 2…¡ 2ƒ’2…00 2001…ƒ 3ƒ…0 ’2 —hile 1…0 23¡…1 2…1 1… 3…3 3…’ 6’…0ƒ ƒ0…3ƒ 1’…ƒ 0 ¨ene§uela 31…1 1¡…ƒ –ƒ… –’…0 130…ƒ 62…2 ’3…1’ 1…2ƒ 12…’ 1 €eru 31…’ 1… 2…6 2…’ 3…6 3…2 3…2 2…’ 1’…’ 61 Ecuador 16…1 ¡…¡ 0…2 3…ƒ ’…1 3…6 1…00 1…00 0…0 6ƒ ominican ˜epublic 10… 66…3 6…’ ƒ…0 0…¡ 3…0 ’…60 ’3…6 ’…ƒ 6 uatemala 16…3 62…ƒ 3…ƒ ’…0 2…3 3…’ ƒ…6¡ ƒ…ƒ3 –0… ƒ1 ‹ruguay 3…’ ’…0 1… 3… …6 …¡ 2ƒ…2 23…2 1ƒ…2 ƒ2 —osta ˜ica ’… 1…ƒ 2… 3… 1…0 ’… 3’…00 3…32 –0… ƒ €anama 3…¡ ’ƒ…’ 6…1 6…2 1…2 2…6 1…00 1…00 0…0 2 Trinidad and Tobago 1…’ 2… 1…0 0…¡ … …ƒ 6…3¡ 6…’1 –0…3 —ayman slands 0…1 3…ƒ 2…2 2…1 0…1 1…6 0…3 0…3 0…0 Total 1 0.0 5 114.2 –0.5 1.2 uro‡e ’ ermany 1…ƒ 3 3’…3 1… 1…6 0…2 0…¡ 0…¡0 0…ƒ 1¡… ‹nited –ingdom 6…2 2 ’¡…1 2…2 2…¡ 0…1 1… 0…6 0…61 ƒ… 6 ¥rance 66…3 2 ’22… 1…1 0…2 0…0 0… 0…¡0 0…ƒ 1¡… taly 61…1 1 1’…ƒ 0…6 –0…3 0…0 0…3 0…¡0 0…ƒ 1¡… 13 ˜ussia 1’3… 1 236…’ –3…ƒ 0… 1… ƒ… 60…¡’ 3…3 … 1’ „pain ’6…’ 1 1¡¡…ƒ 3…2 1…’ –0… –0…1 0…¡0 0…ƒ 1¡… 1ƒ Netherlands 16…¡ ƒ2…2 1…¡ 1…0 0…6 1…0 0…¡0 0…ƒ 1¡… 1 Turey ƒ… ƒ1¡…1 3…6 3…0 ƒ…ƒ …¡ 2…ƒ2 2…1¡ 2’…3 1¡ „wit§erland …3 66’…¡ 0…¡ 1…¡ –1…1 0…0 0…¡6 0…¡1 …2 2’ „weden ¡… ’¡1…ƒ 3… 2…’ 0…0 –0…2 …’3 6…6 23…0 2 €oland 3…0 ’0…ƒ 3… 3…3 –0…¡ 0…2 3…ƒƒ 3…1 1¡…6 26 ¦elgium 11…3 ’…0 1…’ 1…3 0…6 0…3 0…¡0 0…ƒ 1¡… 30 ustria …6 3ƒ’…0 0… 0… 0…¡ 1…6 0…¡0 0…ƒ 1¡… 31 Norway …2 312… 1…ƒ 2…2 2…2 2…1 …0ƒ 6…30 2…1 36 enmar …ƒ 2¡…0 1…2 1…3 0… 0…6 6…ƒ3 …62 1¡… ’3 reland ’…ƒ 232…’ 6…¡ …2 0…0 0…3 0…¡0 0…ƒ 1¡… ’’ ¥inland … 22¡…ƒ 0…’ –0…ƒ –0…2 1…0 0…¡0 0…ƒ 1¡… ’6 €ortugal 10…’ 1¡¡…1 1… 0…¡ 0… –0…3 0…¡0 0…ƒ 1¡… ’ƒ reece 10…¡ 1¡’… –0…3 0…ƒ –1…ƒ –1…3 0…¡0 0…ƒ 1¡… ’¡ —§ech ˜epublic 10… 1¡0… 2…3 2…0 0…3 0…’ 2’…60 20…ƒ6 1… ˜omania 1¡…¡ 166…ƒ 3…ƒ 3…0 –0…6 1…1 ’…01 3…3 1¡…6 ƒ ‘ungary ¡… 121…ƒ 2…3 3…6 –0…1 –0…2 2ƒ¡…33 232…60 20…1 62 ‹raine ’’… ¡’…¡ –11…ƒ 2…ƒ ’…0 12…2 22…20 11…¡ 6… 63 „lovaia …’ ¡1…ƒ 3…6 2… –0…3 –0…1 0…¡0 0…ƒ 1¡… ƒ0 ”uxembourg 0…6 …6 ’… ’…1 0…1 0…ƒ 0…¡0 0…ƒ 1¡… ƒ3 ¦ulgaria ƒ…2 ’¡…1 1… 1…ƒ –0…1 –1…’ 1…ƒ6 1…’ƒ 1¡…ƒ ƒ’ —roatia ’…3 ’… 0…3 –0…’ –0… –0…2 6…6 …ƒ 1¡…3 ƒƒ „lovenia 2…1 ’3… 2…6 3…0 –0… 0…2 0…¡0 0…ƒ 1¡…ƒ ƒ¡ „erbia ƒ…2 36… 0…ƒ –1… 1…6 2…1 10…ƒ …’1 23…0 3 —yprus 0…¡ 1¡…3 0…3 –2…¡ –1…6 –0…3 0…¡0 0…ƒ 1¡… 6 ‚alta 0…’ ¡…6 …1 ’…1 1…2 0… 0…¡0 0…ƒ 1¡… ƒ ”iechtenstein 0…0 6…2 1… 2… –1…1 0…0 0…¡6 0…¡1 …2 Total 1 20.1 1‹ 441.0 1. 1.4 ’sia 2 €˜ —hina 1 3ƒ6… 10 11…’ 6…¡ ƒ…3 1…’ 2…0 6…2 6…16 2…0 3 •apan 126… ’ 16…1 0… –0…1 0…2 2…¡ 120…11 10¡…¡ ¡…2 ƒ ndia 1 313…0 2 06… ƒ…3 ƒ…2 ’…¡ 6…6 6…’6 61…1 ƒ…0 11 „outh –orea 0…6 1 3’…2 2…6 3…3 0… 1…1 11…’ƒ 1060… ¡…2 16 ndonesia 2ƒ…¡ 61…ƒ ’… …0 6…’ 6…’ 133¡3…ƒ 110…00 13…0 20 „audi rabia 31… 63…2 3…’ 3…6 2…2 2…ƒ 3…ƒ 3…ƒ 0…0 22 Taiwan 23…’ 0…¡ 0…¡ 3…¡ –0…3 1…2 31…¡1 30…36 …1 2ƒ ‹nited rab Emirates ¡…2 ’2¡…ƒ 2…ƒ ’…6 ’…1 2…3 3…6ƒ 3…6ƒ 0…0 2 Thailand 6…0 3¡…3 2… 0… –0…¡ 1…¡ 3’…2 32…’ …’ 2¡ ran ƒ¡…1 3… 1…2 ’…3 12…2 1…6 30’6…2ƒ 26’¡2…03 1…0 3’ ‘ong –ong ƒ…3 30¡…¡ 2…’ 2…6 3…0 ’… ƒ…ƒ ƒ…ƒ 0…0 3ƒ „ingapore … 2¡2…ƒ 2…0 3…3 –0… 1…0 1…3ƒ 1…2ƒ … 3 €hilippines 100…¡ 2¡2…0 … 6…1 1…’ ’…2 ’…0 ’’…’0 2… 3¡ srael …1 26…1 2…3 2…6 –0…6 0… 3…¡ 3… …6 ’0 ‚alaysia 30…’ 2’…2 …0 6…0 3…0 2…’ ’…0ƒ 3…3 21…’ ’1 €aistan 1…¡ 266…’ ’…2 ’…0 2… ƒ…2 102…ƒ 101…10 1…ƒ ’ ¦angladesh 161…0 21… 6…6 6… 6…3 ƒ…0 ƒ…’¡ ƒƒ…6’ 1…1 ’ ¨ietnam ¡3…’ 1¡1…’ 6…ƒ 6…0 0…¡ ’…ƒ 21¡0…0 211¡…2 3…’ 2 ·atar 2…2 1’…3 3…ƒ ’…0 1…ƒ 3…3 3…6’ 3…6’ 0…0 ’ –a§ahstan 1ƒ…6 16…0 1…2 ’…3 6… 6…ƒ 221…ƒ3 1ƒ¡…1¡ 23…ƒ –uwait 3…¡ 116…6 1…2 –1…6 3…3 2…¡ 0…30 0…2 …ƒ 6’ „ri ”ana 20…ƒ ƒƒ…6 6…2 ƒ…’ 0…ƒ 3…3 13’…1 130…ƒ 3…2 6 ¢man ’… ƒ1…ƒ 3…1 2…¡ 0…1 1…0 0…3 0…3 0…0 66 ‚acao 0…6 66…’ –20…0 –0…3 ’… 6…0 ƒ…¡¡ ƒ…¡¡ 0…0 ƒ6 ”ebanon …¡ ’’… 1…0 2…0 –3…ƒ 1…1 10ƒ…0 10ƒ…0 0…0 0 •ordan ƒ…6 36…6 2… 3…1 –0… 2…¡ 0…ƒ1 0…ƒ1 0…0 1 ¦ahrain 1…3 30…’ 2… ’… 1… 2…ƒ 0…3 0…3 0…0 Total 1 4 11. 25 1‹5.5 4.5 4. ’frica 23 Nigeria 12…2 ’¡3…3 3…2 6…3 ¡…0 …1 1¡ƒ…ƒ6 1… 2’…ƒ 32 „outh rica ’…6 312… 1…3 1…6 ’…6 6…1 12…ƒ6 10… 1ƒ…6 33 Egypt ¡1… 310… ’…2 2…2 11…1 10…0 ƒ…3 6…¡ƒ …’ 6 lgeria 3¡…ƒ 13…0 2…6 3… ’…ƒ 2…¡ 100…16 0… 2’…3 ¡ ngola 2…0 10’…ƒ 3… ’…’ 10…2 ƒ…3 11¡…0 ¡…1’ 21… 60 ‚orocco 3’…’ 102… ’… 2…’ 1…ƒ 0…’ ¡…ƒ …’1 1…¡ 6¡ –enya ’6…1 60…3 …3 …3 6…6 6…¡ ¡…1 ƒ…¡2 11…6 ƒ Tunisia 11…3 ’3…0 0…¡ 2…ƒ ’…2 ’…¡ 1…¡ 1…ƒ0 16…3 ’ Namibia 2… 13…1 ’…¡ 6…’ 3…6 …3 12…ƒ6 10…3 1ƒ… ‚auritius 1…3 11…ƒ 3…6 3… 1…3 3…2 3’…ƒ3 30…20 1…0 Total 1 1 1ˆ2.1 2 214.ˆ . .4 –ceania 12 ustralia 23…¡ 1 2’…1 2… 2…6 1… 2… 1…33 1…11 20…0 3 New ¹ealand ’… 16…2 2…2 3…0 0…’ 0…¡ 1…’ 1…21 1¡…¡ Total 1 .‹ 1 441.ˆ 2.5 2.ˆ World World ˆ 0.2 ˆ 04‹.ˆ 2.5 2. Swiss Re sigma No 3/2016 ’ƒ
€ublished by“ „wiss ˜einsurance —ompany ”td Explore and visuali§e sigma data on natural catastrophes and Economic ˜esearch ™ —onsulting the world insurance marets at www…sigmaŽexplorer…com €…¢… ¦ox © 201 „wiss ˜e… ll rights reserved… 022 ¹urich „wit§erland The editorial deadline or this study was 2¡ •une 2016… Telephone £’1 ’3 2 21 sigma is available in English †original language‡‰ erman‰ ¥rench‰ ¥ax £’1 ’3 22 00ƒ „panish‰ —hinese and •apanese… sigmaÂswissre…com sigma is available on „wiss ˜e’s website“ www…swissre…com/sigma rmon ¢ice“ The internet version may contain slightly updated inormation… 1ƒ –ing „treet rmon‰ Nµ 100’ Translations“ Telephone £1 ¡1’ 2 000 erman“ iction ¥rench“ ithaxa —ommunications „ ˜” „panish“ Traductores sociados ¨alencia „…”… ‘ong –ong ¢ice“ raphic design and production“ 1 ‘arbour ˜oad‰ Œanchai —orporate ˜eal Estate ™ ”ogistics / ‚edia €roduction‰ ¹urich —entral €la§a‰ 61st ¥loor ‘ong –ong‰ „ ˜ €rinting“ ‚ulticolor €rint ‰ ¦aar Telephone £ 2 2 2 ƒ03 uthors“ aniel „taib Telephone £’1 ’3 2 136 This report is printed on sustainably produced paper… The wood used comes rom orest certiied to 100ˆ by the ¥orest „tewardship r… ‚ahesh ‘… €uttaiah —ouncil †¥„—‡… Telephone £¡1 0 ’¡00 212ƒ © 201 „wiss ˜e sigma editor“ ll rights reserved… €aul ˜one The entire content o this sigma edition is subŠect to copyright with all Telephone £’1 ’3 2 2660 rights reserved… The inormation may be used or private or internal Editor in chie purposes‰ provided that any copyright or other proprietary notices are –urt –arl‰ not removed… Electronic reuse o the data published in sigma is ‘ead o Economic ˜esearch ™ —onsulting‰ is prohibited… responsible or the sigma series… ˜eproduction in whole or in part or use or any public purpose is permitted only with the prior written approval o „wiss ˜e Economic ˜esearch ™ —onsulting and i the source reerence “„wiss ˜e‰ sigma No 0’/201” is indicated… —ourtesy copies are appreciated… lthough all the inormation used in this study was taen rom reliable sources‰ „wiss ˜e does not accept any responsibility or the accuracy or comprehensiveness o the inormation given or orward looing statements made… The inormation provided and orwardŽlooing statements made are or inormational purposes only and in no way constitute or should be taen to relect „wiss ˜e’s position‰ in particular in relation to any ongoing or uture dispute… The inormation does not constitute any recommendation‰ advice‰ solicitation‰ oer or commitment to eect any transaction or to conclude any legal act o any ind whatsoever… n no event shall „wiss ˜e be liable or any loss or damage arising in connection with the use o this inormation and readers are cautioned not to place undue reliance on orwardŽlooing statements… „wiss ˜e undertaes no obligation to publicly revise or update any orwardŽlooing statements‰ whether as a result o new inormation‰ uture events or otherwise… ¢rder no“ 2ƒ0Ä0316Äen
„wiss ˜e ”td Economic ˜esearch ™ —onsulting ‚ythen«uai 0 /60 €…¢… ¦ox 022 ¹urich „wit§erland Telephone £ ’1 ’3 2 21 ¥ax £’1 ’3 22 00ƒ sigmaÂswissre…com