
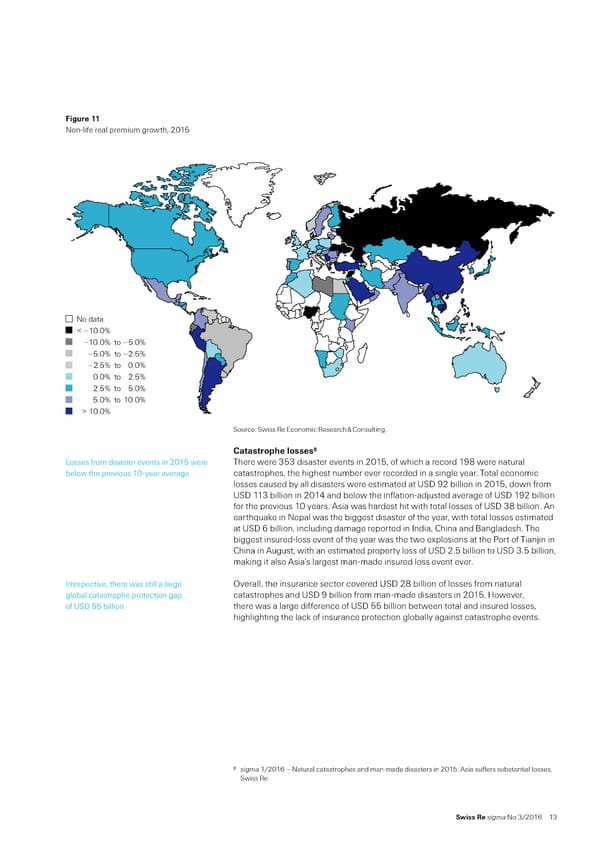
Figure 11 NonŽlie real premium growth‰ 201 No data < –10.0% –10.0% to –5.0% –5.0% to –2.5% –2.5% to 0.0% 0.0% to 2.5% 2.5% to 5.0% 5.0% to 10.0% > 10.0% „ource“ „wiss ˜e Economic ˜esearch ™ —onsulting… Œatastro‡‚e losses ”osses rom disaster events in 201 were There were 33 disaster events in 201‰ o which a record 1¡ were natural below the previous 10Žyear average… catastrophes‰ the highest number ever recorded in a single year… Total economic losses caused by all disasters were estimated at ‹„ ¡2 billion in 201‰ down rom ‹„ 113 billion in 201’ and below the inlationŽadŠusted average o ‹„ 1¡2 billion or the previous 10 years… sia was hardest hit with total losses o ‹„ 3 billion… n earth«uae in Nepal was the biggest disaster o the year‰ with total losses estimated at ‹„ 6 billion‰ including damage reported in ndia‰ —hina and ¦angladesh… The biggest insuredŽloss event o the year was the two explosions at the €ort o TianŠin in —hina in ugust‰ with an estimated property loss o ‹„ 2… billion to ‹„ 3… billion‰ maing it also sia’s largest manŽmade insured loss event ever… rrespective‰ there was still a large ¢verall‰ the insurance sector covered ‹„ 2 billion o losses rom natural global catastrophe protection gap catastrophes and ‹„ ¡ billion rom manŽmade disasters in 201… ‘owever‰ o ‹„ billion… there was a large dierence o ‹„ billion between total and insured losses‰ highlighting the lac o insurance protection globally against catastrophe events… 8 sigma 1/2016 – Natural catastrophes and manŽmade disasters in 201“ sia suers substantial losses‰ „wiss ˜e… Swiss Re sigma No 3/2016 13
 World Insurance in 2015 Page 18 Page 20