
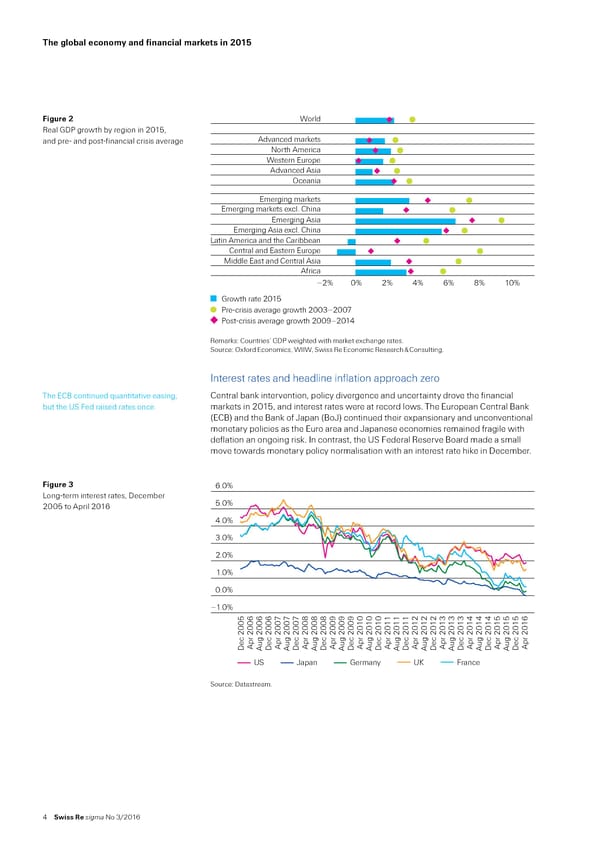
T‚e gloƒal econo€ and financial ar„ets in 2015 Figure 2 rld ˜eal € growth by region in 201‰ and preŽ and postŽinancial crisis average Adanced markets rth America estern Ere Adanced Asia ceania Emerging markets Emerging markets excl. China Emerging Asia Emerging Asia excl. China Latin America and the Caribbean Central and Eastern Ere Middle East and Central Asia Aˆrica –2% 0% 2% 4% 6% 8% 10% †r‚th rate 201‡ re€crisis aerage gr‚th 200„–200… st€crisis aerage gr‚th 200ƒ–2014 ˜emars“ —ountries’ € weighted with maret exchange rates… „ource“ ¢xord Economics‰ ŒŒ‰ „wiss ˜e Economic ˜esearch ™ —onsulting… nterest rates and headline inlation approach §ero The E—¦ continued «uantitative easing‰ —entral ban intervention‰ policy divergence and uncertainty drove the inancial but the ‹„ ¥ed raised rates once… marets in 201‰ and interest rates were at record lows… The European —entral ¦an †E—¦‡ and the ¦an o •apan †¦o•‡ continued their expansionary and unconventional monetary policies as the Euro area and •apanese economies remained ragile with delation an ongoing ris… n contrast‰ the ‹„ ¥ederal ˜eserve ¦oard made a small move towards monetary policy normalisation with an interest rate hie in ecember… Figure 6.0% ”ongŽterm interest rates‰ ecember 200 to pril 2016 5.0% 4.0% 3.0% 2.0% 1.0% 0.0% –1.0% Dec 2005Apr 2006Aug 2006Dec 2006Apr 2007Aug 2007Dec 2007Apr 2008Aug 2008Dec 2008Apr 2009Aug 2009Dec 2009Apr 2010Aug 2010Dec 2010Apr 2011Aug 2011Dec 2011Apr 2012Aug 2012Dec 2012Apr 2013Aug 2013Dec 2013Apr 2014Aug 2014Dec 2014Apr 2015Aug 2015Dec 2015Apr 2016 US Japan Germany U France „ource“ atastream… ’ Swiss Re sigma No 3/2016
 World Insurance in 2015 Page 8 Page 10