
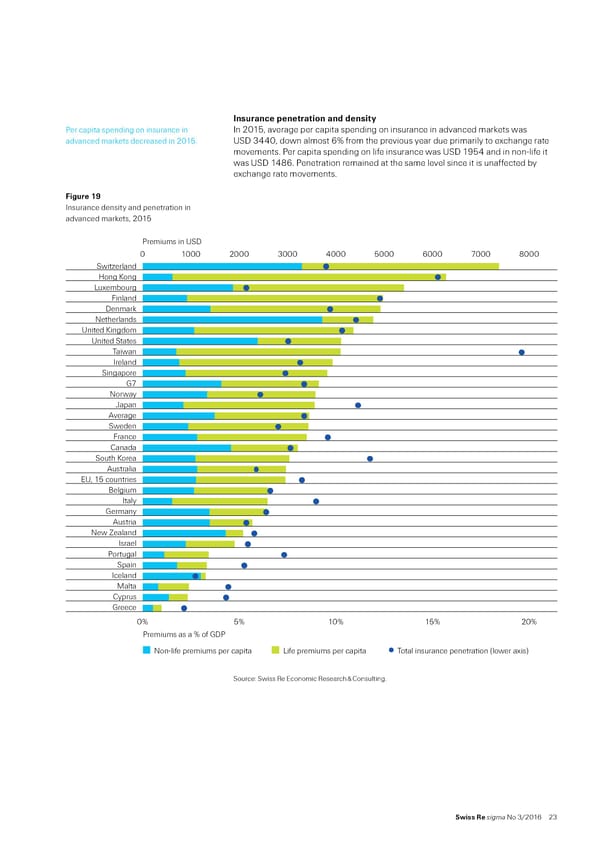
‰nsurance ‡enetration and densit€ €er capita spending on insurance in n 201‰ average per capita spending on insurance in advanced marets was advanced marets decreased in 201… ‹„ 3’’0‰ down almost 6ˆ rom the previous year due primarily to exchange rate movements… €er capita spending on lie insurance was ‹„ 1¡’ and in nonŽlie it was ‹„ 1’6… €enetration remained at the same level since it is unaected by exchange rate movements… Figure 1‹ nsurance density and penetration in advanced marets‰ 201 Premiums in USD 0 1000 2000 3000 4000 5000 6000 7000 8000 Switzerland Hong Kong Luxembourg Finland Denmark Netherlands United Kingdom United States Taiwan Ireland Singapore G7 Norway Japan Average Sweden France Canada South Korea Australia EU, 15 countries Belgium Italy Germany Austria New Zealand Israel Portugal Spain Iceland Malta Cyprus Greece 0% 5% 10% 15% 20% Premiums as a % of GDP Non-life premiums per capita Life premiums per capita Total insurance penetration (lower axis) „ource“ „wiss ˜e Economic ˜esearch ™ —onsulting… Swiss Re sigma No 3/2016 23
 World Insurance in 2015 Page 30 Page 32